EA vs usual care (supportive): −3.94 mg [−19.77, +11.90]
In plain language: The average result favours lower opioid use with TEAS/EA, but the uncertainty includes no difference and a small increase. This standardized value is not a dose in milligrams.
Prespecified analysis of 7 trials; study filters do not recalculate this result.
In plain language: Our confidence in the estimated opioid reduction is limited. The true effect could be substantially different because results vary between studies and the estimate is imprecise.
Certainty for the prespecified primary outcome; study filters do not reassess GRADE.
Background & Rationale
john_ryan.nual_mendoza@med.lu.se), Siv Katrin Peters, Dr. Carina Sjöberg, Dr. Pether Jildenstål • Lund University / Region Skåne
Postoperative opioid consumption remains a cornerstone of acute pain management, yet carries dose-dependent risks including respiratory depression, postoperative nausea and vomiting (PONV), ileus, cognitive dysfunction, and the potential for persistent opioid use. Transcutaneous electrical acupoint stimulation (TEAS) and electroacupuncture (EA) have been proposed as non-pharmacological adjuncts that modulate endogenous opioid peptide release (β-endorphin, enkephalins, dynorphins) through frequency-dependent mechanisms, potentially reducing cumulative postoperative opioid requirements without compromising analgesic adequacy.
Despite over two decades of randomized controlled trials, prior systematic reviews have been limited by pooling heterogeneous modalities, lacking sham controls, and failing to prespecify clinically meaningful thresholds. This review addresses these gaps by implementing rigorous modality stratification (TEAS vs EA), requiring sham/placebo controls for primary analyses, and pre-registering a clinically important opioid-sparing threshold.
PICOS Framework
| Element | Inclusion | Exclusion |
|---|---|---|
| Population | Adult surgical patients (≥ 18 years) undergoing any elective or emergency surgical procedure under general, regional, or combined anaesthesia | Paediatric (< 18 y), non-surgical (chronic pain, obstetric labour, ICU sedation), or animal models |
| Intervention | TEAS: Non-invasive transcutaneous electrical stimulation applied at recognized acupoints via surface electrodes EA: Invasive needle electroacupuncture at acupoints with electrical current |
Manual acupuncture (no electrical current), moxibustion, acupressure, laser acupoint stimulation, TENS at non-acupoints |
| Comparator | Primary: Sham/placebo TEAS or sham EA (identical setup, subthreshold or no current) Supportive: Usual care / no stimulation (open-label) |
Active drug comparators only (e.g., TEAS vs nerve block without a no-stimulation control) |
| Outcomes | Eligibility-conferring outcomes. A trial is eligible only if it reports at least one quantifiable perioperative analgesic outcome: Primary: cumulative 0–24 h postoperative opioid consumption (mg IV morphine equivalents) Key secondary: cumulative 0–48 h postoperative opioid consumption Exploratory: cumulative 0–72 h postoperative opioid consumption Also eligibility-conferring: postoperative pain intensity (VAS/NRS), rescue analgesia, or intraoperative opioid requirement. Extracted but not eligibility-conferring: PONV, time to first flatus and other GI-recovery endpoints, QoR-40/15, PCA demands, length of stay and sleep quality are collected from otherwise eligible trials. Reporting one of these alone, with no eligible analgesic outcome, does not make a trial eligible. This is why Yu Wang et al., JAMA Surgery 2023 (DOI 10.1001/jamasurg.2022.5674) — which reports time to first flatus but no eligible analgesic outcome — was excluded at full text for wrong outcomes. |
Studies reporting no eligibility-conferring analgesic outcome within 0–72 h, including trials whose only quantifiable endpoints are GI-recovery, PONV, or recovery-quality measures |
| Study Design | Randomized controlled trials (RCTs), published in English or Chinese, with full-text availability | Non-randomized studies, observational cohorts, case reports, conference abstracts without full data, reviews |
PROSPERO Registration & Protocol History
Prespecified research objectives, PROSPERO registration history, and methodological amendment timeline.
Quantify 24-h (primary) & 48-h (key secondary) opioid-sparing effects
Synthesis of cumulative 0–24 h primary opioid consumption (mg IV MME), alongside key secondary 0–48 h and exploratory 0–72 h outcomes, stratified by modality. REML random-effects with Knapp–Hartung adjustment and 95% prediction intervals.
Evaluate postoperative pain intensity at rest and during movement at ~24 h
VAS/NRS 0–10 continuous mean difference. Essential for confirming that opioid sparing does not result in clinically important pain worsening.
Identify protocol moderators via prespecified subgroup & Stata meta-regression
Prespecified modality subgroups (TEAS k = 4, EA k = 3) with Knapp–Hartung adjustment. One exploratory meta-regression on modality (p = 0.308); with k = 7 no covariate meets the Cochrane 10:1 rule, so no other moderator is modelled.
Determine clinical meaningfulness against prespecified thresholds
≥ 10 mg IV MME with pain non-inferiority ≤ +1.0 VAS (sensitivity: ≥ 8 mg, ≥ 30% relative, ≥ 5 mg).
Supportive syntheses and additional clinical endpoints
PONV (RR), time to first flatus (hours), PCA pump demands, rescue analgesia (RR), intraoperative remifentanil, QoR-40/15, length of stay, and sleep quality.
Assess certainty of evidence using RoB 2 and GRADE
Cochrane Risk of Bias 2 across all 5 domains. GRADE Summary of Findings with downgrade assessment for risk of bias, inconsistency, indirectness, imprecision, and publication bias.
Verified Evidence Synthesis Summary (StataNow 19.5 BE Validated)
Executed with restricted maximum likelihood (REML) and Hartung–Knapp standard errors on defensible, audited study sets:
Only the primary 24-h opioid card above is split by modality and comparator (TEAS vs sham; EA vs usual care), as the protocol requires. The other cards (Targets C–F) pool across modality and comparator and predate that restratification; see the Forest Plot Gallery below for the modality/comparator composition of each and the current, separately-stratified v34 equivalents where one exists.
Surgical Specialties Distribution (69 trials / 70 reports)
Methodological Architecture & Design Separation
PRISMA 2020 Flow Diagram
Live Study Selection Process from Covidence Extraction Audit
Corrected_RoB2 has a full 5-domain + overall judgement for every row in Study_Master, no gaps) and is reflected in the Study Explorer and RoB 2 tabs. Only Szmit 2021 contributes to a locked pooled result (the strict primary 24-h opioid analysis and the Target D nausea 0–24h stratum). The dedicated eligibility reconciliation pass for the other six was completed 2026-09-12 and is shown in full on the Study Explorer: 19 study-outcome dispositions, each with the rule behind it and what would unblock it. Three outcomes clear on data grounds and now await review-team admission (Zhang 2018 time to first flatus, unblocked by a validated figure digitisation; Song 2020 24-h pain and 24-h PONV, unblocked because the ITT/per-protocol question holding them turned out to be answered in the source). Two more (Gao 2022 24-h pain and PONV) are blocked by a rule rather than by data and need a ruling rather than a re-read. The remaining thirteen are closed: five because the source does not report the value, two because no defensible derivation exists, and six because the value falls outside the target's own definition. The pass pools nothing — admitting a study to a locked analysis remains a review-team act. Superseded 2026-09-12: this paragraph previously closed by stating that the modality split, comparator split and total randomized-patient count in the “Included” card remained under reconciliation. They no longer do. All three are computed live from the register the Study Explorer renders from, which is itself regenerated from the locked v34 master and checked against it on every build, so the card cannot disagree with the per-study data. Two things changed with that reconciliation: modality and comparator are counted over the 69 trials rather than the 70 reports (48 TEAS / 21 EA, 57 sham / 12 usual care), and the participant figure is the number analysed, summed once per trial (10,618), not the 70-report sum of 10,678. What is not available is a review-wide randomized participant total: only 17 of the 69 trials record a randomized denominator in either the register or their source PDF, and the two channels measure different quantities, so no such total is published.
- Embase (Elsevier.com)1,928 (37.8%)
- Cochrane CENTRAL1,698 (33.3%)
- PubMed (MEDLINE)1,009 (19.8%)
- CINAHL Ultimate465 (9.1%)
- Duplicate records removed by Covidence1,651
- Duplicate records removed manually1
- Marked ineligible by automation tools508
- Wrong outcome — no eligible perioperative outcome reported ⓘ117 (83.0%)
- Wrong setting (chronic / non-surgical)9 (6.4%)
- Wrong intervention (manual/moxibustion)9 (6.4%)
- Wrong comparator (active drug only)3 (2.1%)
- Wrong patient population (pediatric/animal)2 (1.4%)
- Wrong study design (non-RCT)1 (0.7%)
• 70 reports describing 69 studies (1 linked cohort)
• RoB 2 complete for all 70 reports (verified 2026-09-07)
• 19/19 P1 issues dispositioned (0 blockers)
69 randomized trials from 70 included reports • 10,618 participants analysed across the 69 trials, counting each trial once • 48 TEAS / 21 EA • 57 sham-controlled / 12 usual-care-controlled. A review-wide randomized participant total is not reported: most trials state only their analysed denominators (see Population Characteristics in the Study Explorer).
dashboard/data.js, regenerated from the locked v34 master and checked against it on every build), not restated from the PRISMA docx, which does not itself give participant totals. Modality and comparator are trial properties and are counted over the 69 trials, so they differ by one from the 70-report tallies (48 TEAS / 22 EA, 58 sham / 12 usual care) quoted where the unit is reports. Participants are summed once per trial, so the linked Yeh cohort is no longer double-counted; the earlier figure of 10,678 was the 70-report sum.PRISMA 2020 checklist — item by item, mapped to this review
✅ PRISMA 2020 checklist
Bibliographic Search Strategies & Concept Architecture
Multi-Database Search Syntax, Boolean Operators, and Retrieval Statistics
Search Concept Map & Intersecting Facets
| Domain Facet | Controlled Descriptors (MeSH / Emtree / CINAHL) | Key Natural Language Textwords (Title/Abstract/Keywords) |
|---|---|---|
| Intervention: TEAS Non-invasive surface acupoint stimulation |
"Transcutaneous Electric Nerve Stimulation"[Mesh] AND "Acupuncture Points"[Mesh]; 'transcutaneous electrical nerve stimulation'/exp AND ('acupuncture'/exp OR 'acupuncture point'/exp); MH "Transcutaneous Electric Nerve Stimulation" AND MH "Acupuncture Points" | TEAS, TAES, "transcutaneous electrical acupoint stimulation", "transcutaneous electric acupoint stimulation", "transcutaneous acupoint electrical stimulation", "electroacupoint stimulation", "acupuncture-like TENS" |
| Intervention: EA Invasive needle electroacupuncture |
"Electroacupuncture"[Mesh]; 'electroacupuncture'/exp; MH "Electroacupuncture" | electroacupunctur*, electro-acupunctur*, "electro acupuncture", "electric acupuncture", "electrical acupuncture" |
| Population: Surgical Perioperative surgical patients under GA |
"Surgical Procedures, Operative"[Mesh]; "Anesthesia"[Mesh]; 'surgery'/exp; 'anesthesia'/exp; MH "Surgery, Operative+"; MH "Anesthesia+"; MH "Perioperative Care+" | surg*, operat*, perioperat*, peri-operat*, intraoperat*, intra-operat*, postoperat*, post-operat*, preoperat*, anesthe*, anaesthe* |
| Study Design: RCT Filter Validated methodological trial filters |
pt "randomized controlled trial"; pt "controlled clinical trial"; 'randomized controlled trial'/exp; 'controlled clinical trial'/de; MH "Randomized Controlled Trials+" | randomized, randomised, placebo, randomly, "double-blind", "single-blind", trial, "intermethod comparison" |
Study Characteristics & STRICTA Parameters Explorer
| Study Key | Year | Country | Surgical Category | Modality | Comparator | Randomized N NR where the trial does not report one |
Analysed N denominators used in synthesis |
Age, mean ± SD intervention / comparator |
Female intervention / comparator |
Result-Specific RoB 2 | Actions |
|---|
Cochrane Risk of Bias 2 (RoB 2) Traffic Light Studio
Result-specific RoB 2 assessments adhering to Cochrane guidelines. Select an outcome below to inspect result-specific domain judgments or view the overall study summary.
| Study Identifier | D1: Randomization | D2: Deviations | D3: Missing Data | D4: Measurement | D5: Selection | Overall RoB | Signaling Rationale |
|---|
Source-verified Stata secondary analyses
Exploratory Interactive Forest Plot
Binary outcomes apply the Haldane–Anscombe continuity correction (+0.5 to each of the four cells of the 2×2 table, so each arm's denominator gains 1) to all contrasts, not only zero-cell tables — review team decision, 2026-09-11. As of 2026-09-12 this holds everywhere: the Stata analyses above were re-run under the same correction, so this plot and the source-verified models are on one scale. They remain different analyses with different contributing trials, so their numbers are still not expected to match each other. Continuous outcomes are unaffected.
HISTORICAL (2026-09-11 to
2026-09-12): for one day this note also said the saved Stata analyses still
used the uncorrected estimator, because the universal correction reached the
browser plot first and the Stata re-run was pending. That is no longer true and the
paragraph above supersedes it: 05_ponv.do, 07_targetF.do and
12_stratum_compliant_refit.do each now build the corrected 2×2 cells
before meta set, and every published binary result comes from those runs.
Kept, labelled, because a reader who saw the earlier wording should be able to find out
what changed.
| Inc | Study Identifier | Comparison | Intervention Mean ± SD (N) | Control Mean ± SD (N) | Mean Difference [95% CI] | Weight | Forest Plot [95% CI & Prediction] |
|---|
Exploratory Paired Opioid–Pain Analysis (Objective 4 Studio)
Evaluating whether 0–24h Opioid Reduction achieves prespecified clinical-importance benchmarks (Primary: ≥ 10 mg IV MME) without clinically important worsening of postoperative pain (≤ +1.0 VAS margin; upper 95% CI examined).
Current analyses (v34) — models, withdrawals and source holds
📊 Current Analyses
Manuscript evidence map — what we can write, and what a reviewer will ask
📝 Manuscript Evidence Map
Comparison with the prior meta-analysis — why our estimate differs
📚 Comparison with prior evidence
How the included trials contribute — why 69 trials give 7 in the primary analysis
🗺️ How the Included Trials Contribute
Retired v33 secondary analyses — superseded by the current v34 set
Primary outcome contribution pathway — which trials carry 24-hour data
Primary Outcome Contribution Pathway
| Study | In systematic review | Reports opioid outcome | 24-h candidate | Strict primary | Broader sensitivity | Author contact relevant | Reason / current status |
|---|
Which 0–24 hour evidence can actually be pooled — tier classification
🧭 Which 0–24 Hour Evidence Can Actually Be Pooled
Every estimate on this panel was fitted in StataNow 19.5 by
07_TIERED_V33/02_STATA/13_tiered_primary_v33.do (S0–S3, sensitivity) or
07_TIERED_V33/02_STATA/14_tiered_tierE_smd_v33.do (Tier E scale-free SMD) and read from
07_TIERED_V33/05_RESULTS/TIERED_ANALYSIS_RESULTS_v33.csv and
07_TIERED_V33/05_RESULTS/TIERED_ANALYSIS_RESULTS_v33_tierE.csv. A sensitivity analysis crossing
p = 0.05 does not change a conclusion here: these analyses exist to test robustness and completeness,
not to find significance.
StataNow 19.5 BE Consensus Synthesis & Forest Plots Hub
Locked Protocol Synthesis Standard: In accordance with our PROSPERO protocol, TEAS and electroacupuncture (EA) are never combined into a single grand pooled estimate. Analyses are strictly stratified by modality. Primary comparisons evaluate TEAS versus credible sham TEAS and EA versus sham/control EA. Between-study variance is estimated using restricted maximum likelihood (REML) with Knapp–Hartung confidence intervals and 95% prediction intervals.
Comparator hierarchy. Per protocol, sham/placebo is the principal comparator and usual-care/no-stimulation is supportive. Auditing the seven strict primary trials against this rule: the TEAS stratum (k=4: Chen 1998, Chen 2020, He 2026, Szmit 2021) is sham-controlled, consistent with the principal comparator. The EA stratum (k=3: El-Rakshy 2009, Seevaunnamtum 2016, Yang 2024) is entirely usual-care / open-label control — none of the three is sham-controlled. One sham-controlled EA candidate exists in the wider 24-h pool (Coura 2011), but it is weight-normalised (µg/kg fentanyl) and cannot be converted to an absolute dose without the group-mean-weight reconstruction the lock prohibits, so it is not strict-poolable. There is currently insufficient sham-controlled EA evidence for a pooled primary sham-controlled EA efficacy estimate; the EA stratum shown throughout this dashboard is a usual-care comparison and should be read as such, not as a sham-controlled efficacy result. As of v33 the two strata are no longer combined into a single headline estimate: the sham-controlled TEAS model is the primary analysis and the usual-care EA model is reported separately as supportive, because pooling them averages two different questions.
Sufentanil conversion — corrected 2026-09-07 (affects Chen 2020, 1 of 7 strict primary trials). The mg-MME factor applied to sufentanil was previously 0.1 mg MME/µg (100:1) — identical to the fentanyl ratio, uncited in the source do-file, and supported by no located reference. It has been corrected to 1.0 mg MME/µg (1000:1), at the most-potent end of the published 250:1–1000:1 range (BC Ministry of Health equianalgesic table: 10–40 µg sufentanil = 10 mg parenteral morphine; FDA sufentanil label: “as much as 10 times as potent as fentanyl” in balanced general anaesthesia, the setting of these trials). The correction makes the estimated effect larger, and it creates statistical significance nowhere: the strict primary remains non-significant (p = 0.089), while the Target A broader-window result moved from p = 0.0030 to p = 0.0730, i.e. from significant to non-significant. Residual uncertainty is published as a sensitivity range across factors 0.1 / 0.25 / 0.5 / 1.0. Full audit: 06_FINAL_ANALYSIS_V26/06_AUDIT/opioid_conversion_audit.csv; sensitivity results: 06_FINAL_ANALYSIS_V26/03_RESULTS/results_sufentanil_conversion_sensitivity.csv.
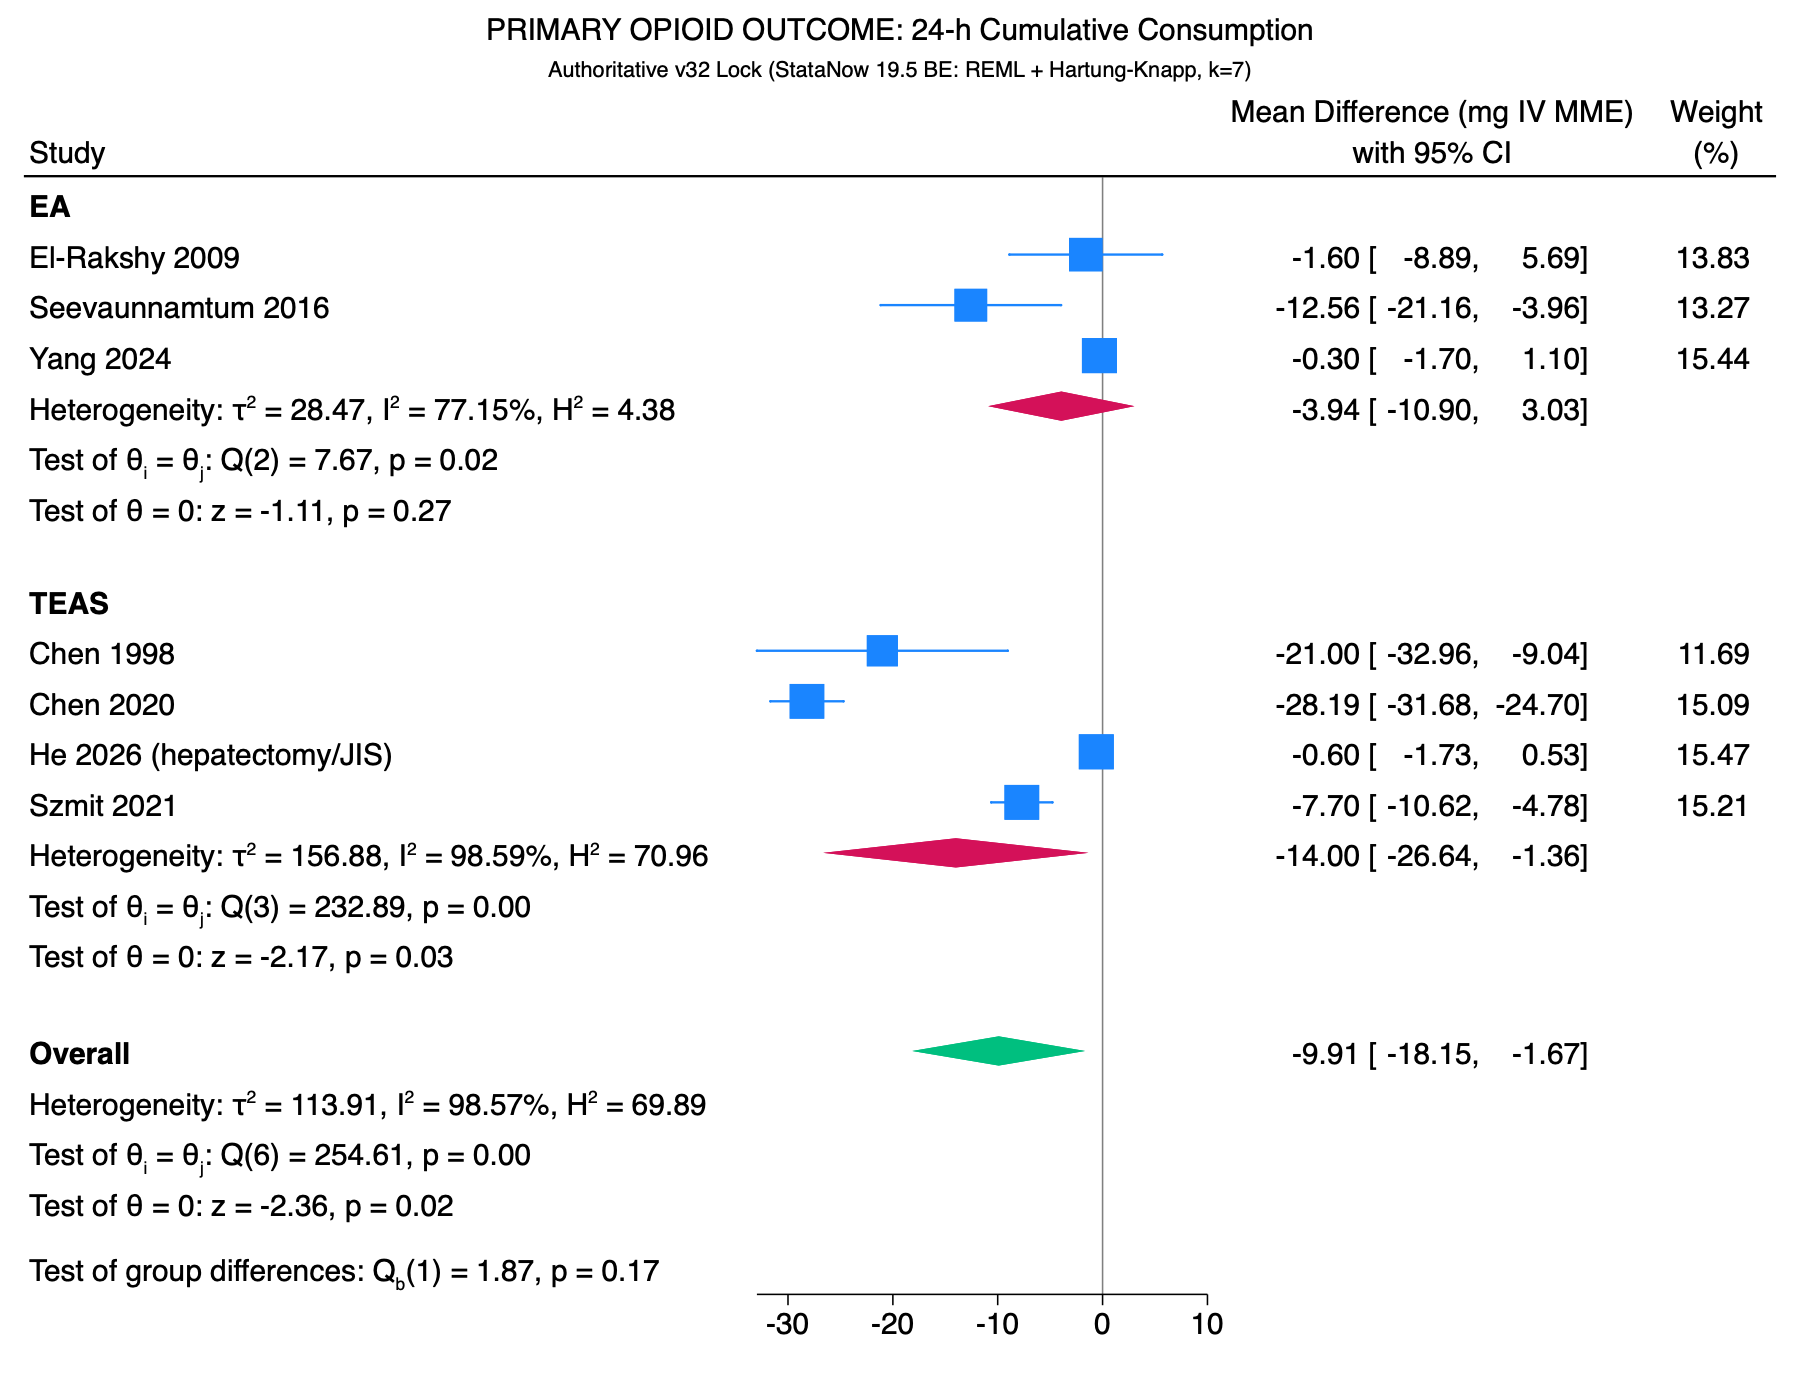
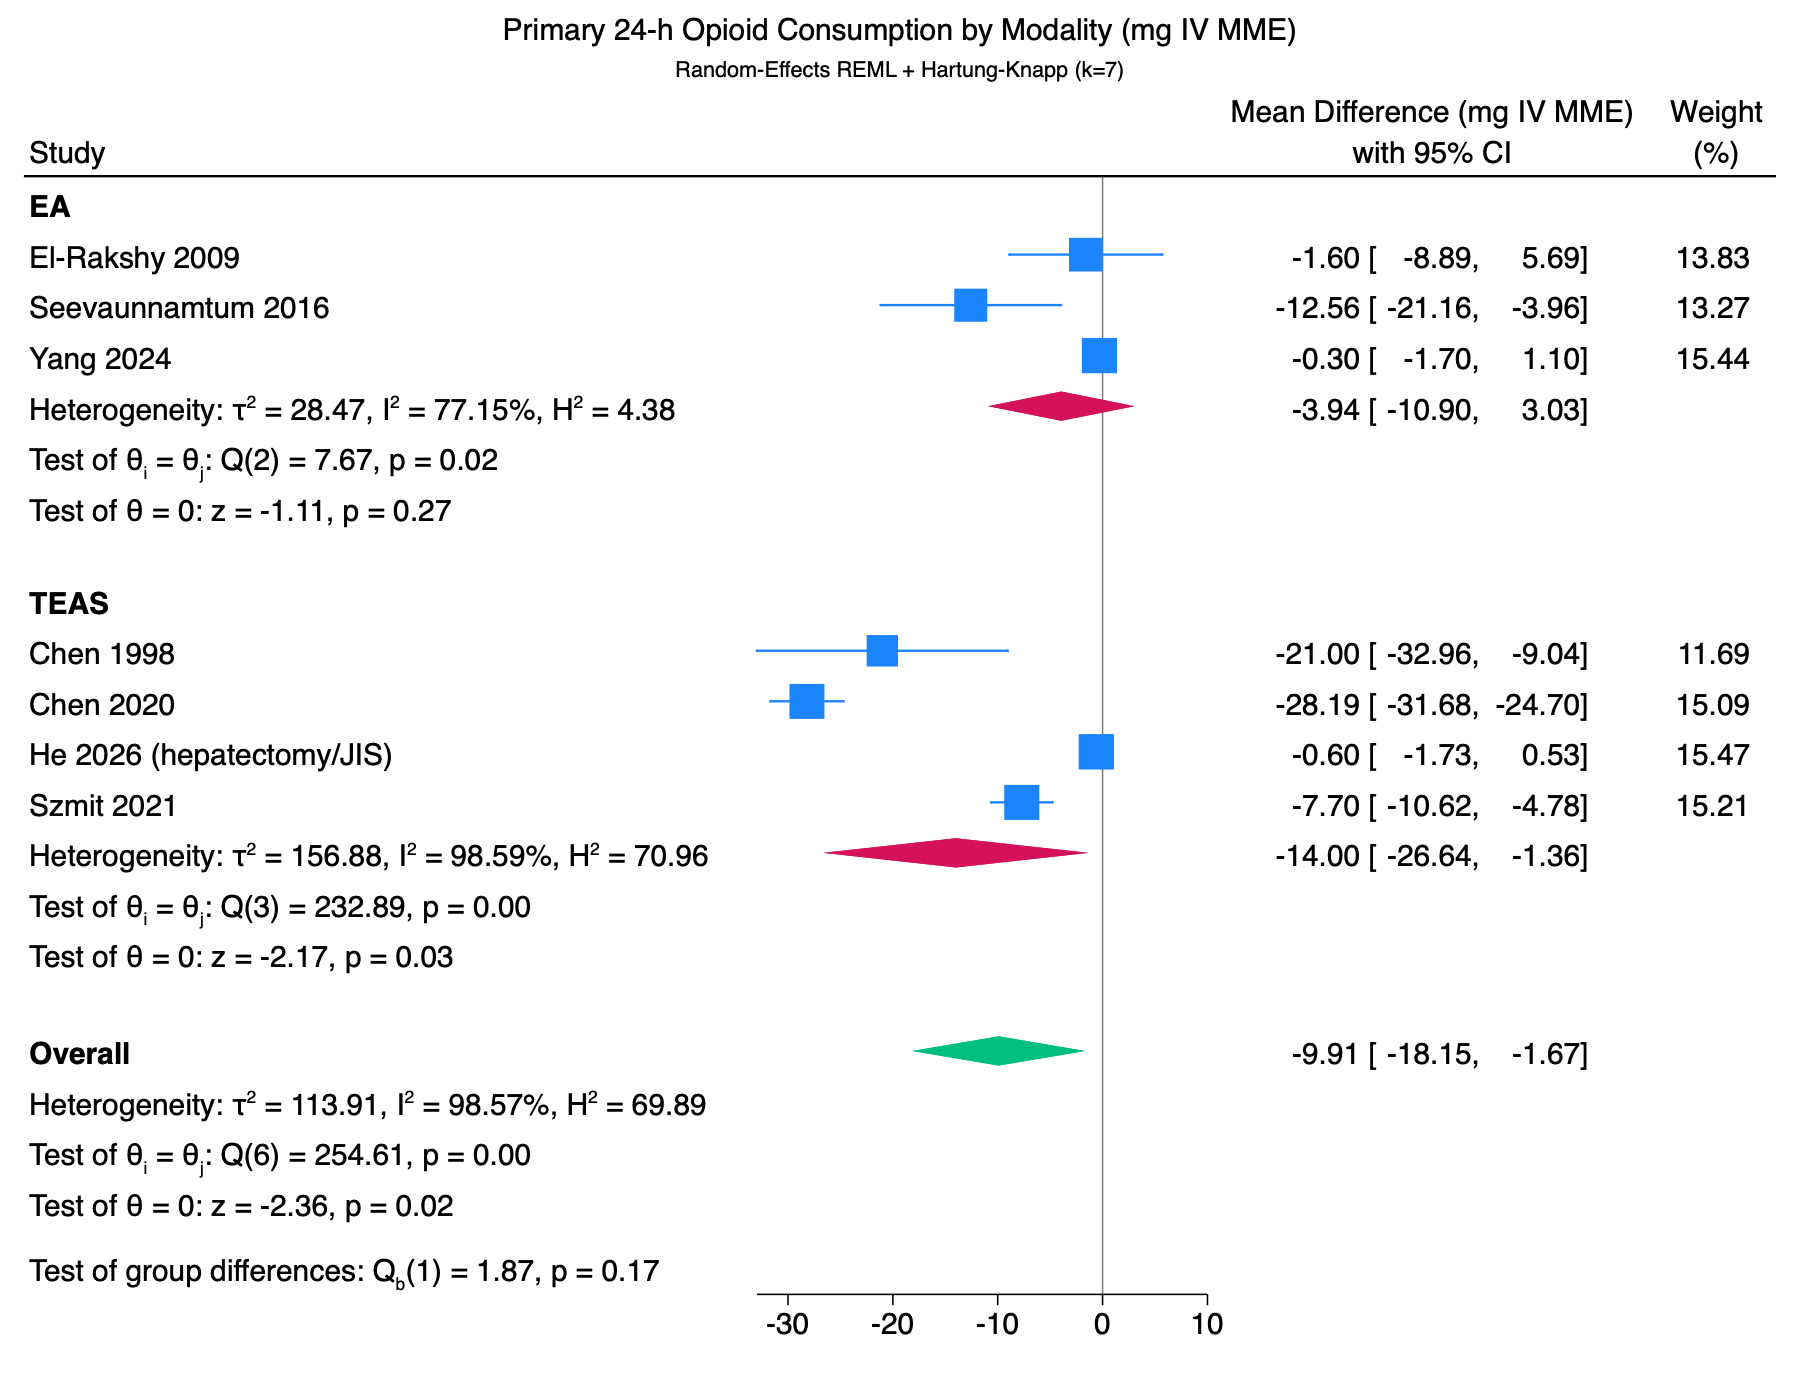
Primary outcome: cumulative 0–24 h opioid sparing (Modality-Specific Primary: TEAS k=4, EA k=3)
Executed in StataNow 19.5 BE via meta summarize, random(reml) se(kh) predinterval. Modalities and reporting strata rigorously tested.
TEAS vs Sham TEAS (0–24h)
Alternative Model Estimates & Estimator Sensitivity
EA vs Usual Care (0–24h)
Alternative Model Estimates & Estimator Sensitivity
Supporting Combined Strict-Evidence Synthesis: 0–24h Opioid Consumption
Alternative Model Estimates & Estimator Sensitivity
Secondary Clinical Endpoints
Other opioid timepoints: 48-hour analyses
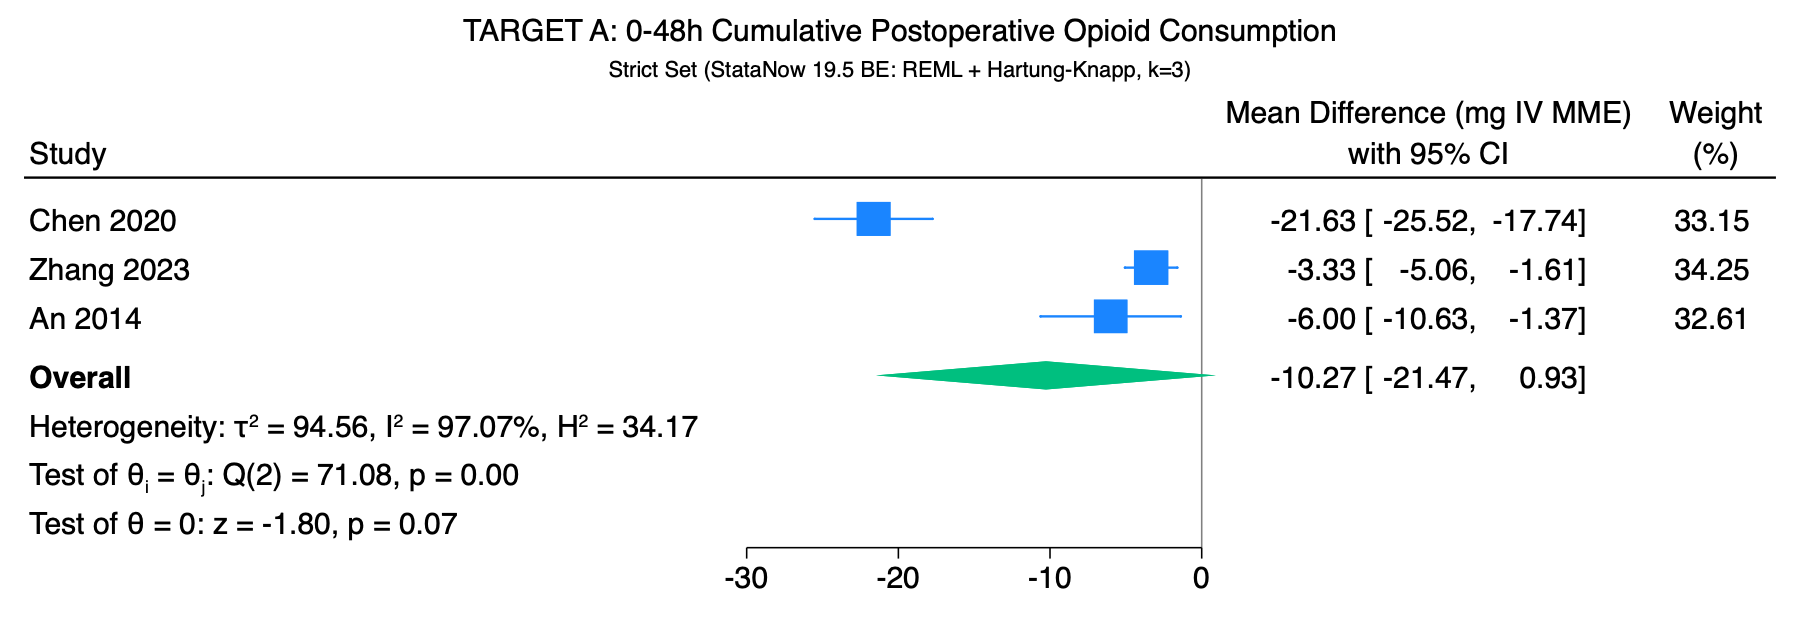
Cumulative 0–48 h opioid sparing (Strict: k = 3 RCTs, N = 1,999)
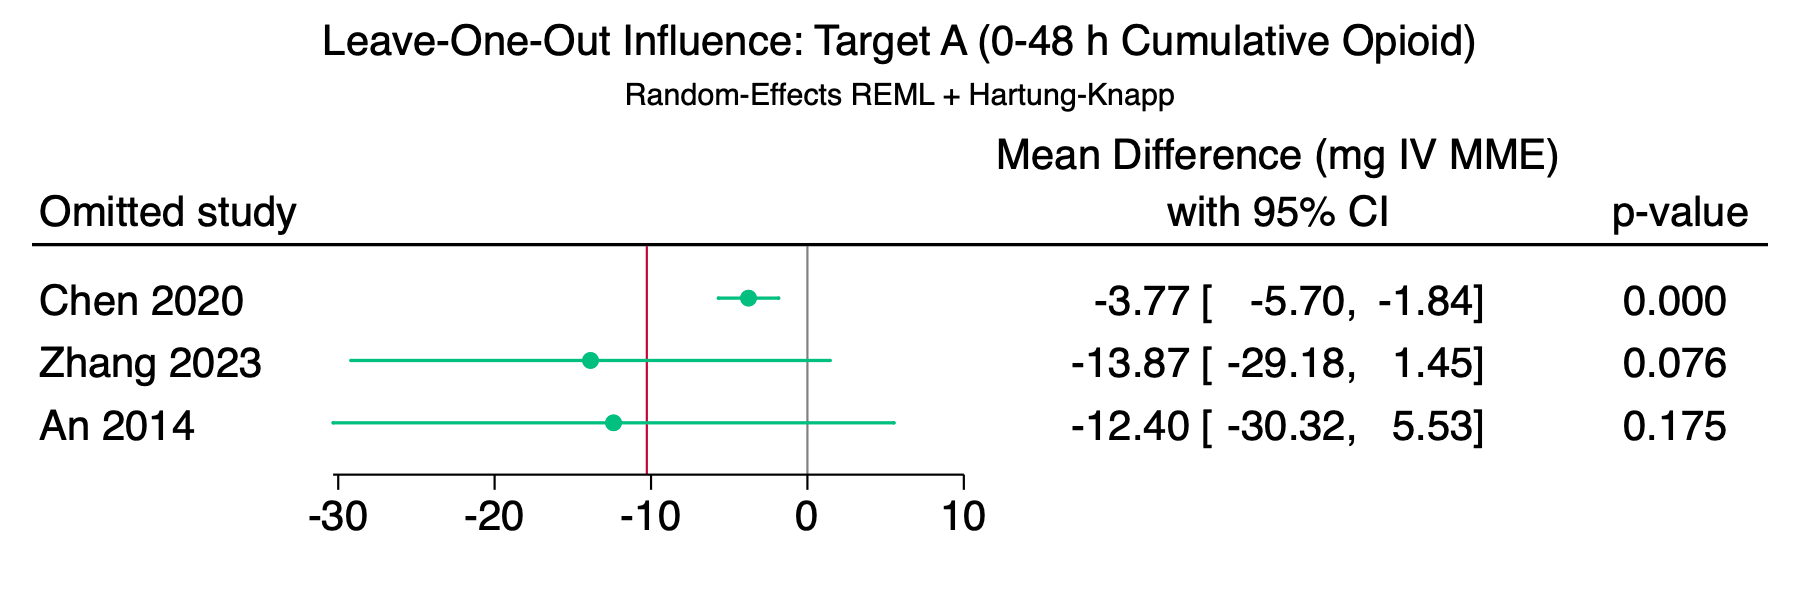
Executed in StataNow 19.5 BE via meta summarize, random(reml) se(kh) predinterval for protocol-compliant trials reporting cumulative 48-hour systemic opioid requirements (Chen 2020, Zhang 2023, An 2014).
Strict Target A Pool
Excluding An 2014
Excluding Converted
Broader Window Pool
48-h PCA Volume Trials
Other opioid timepoints: 72-hour analyses
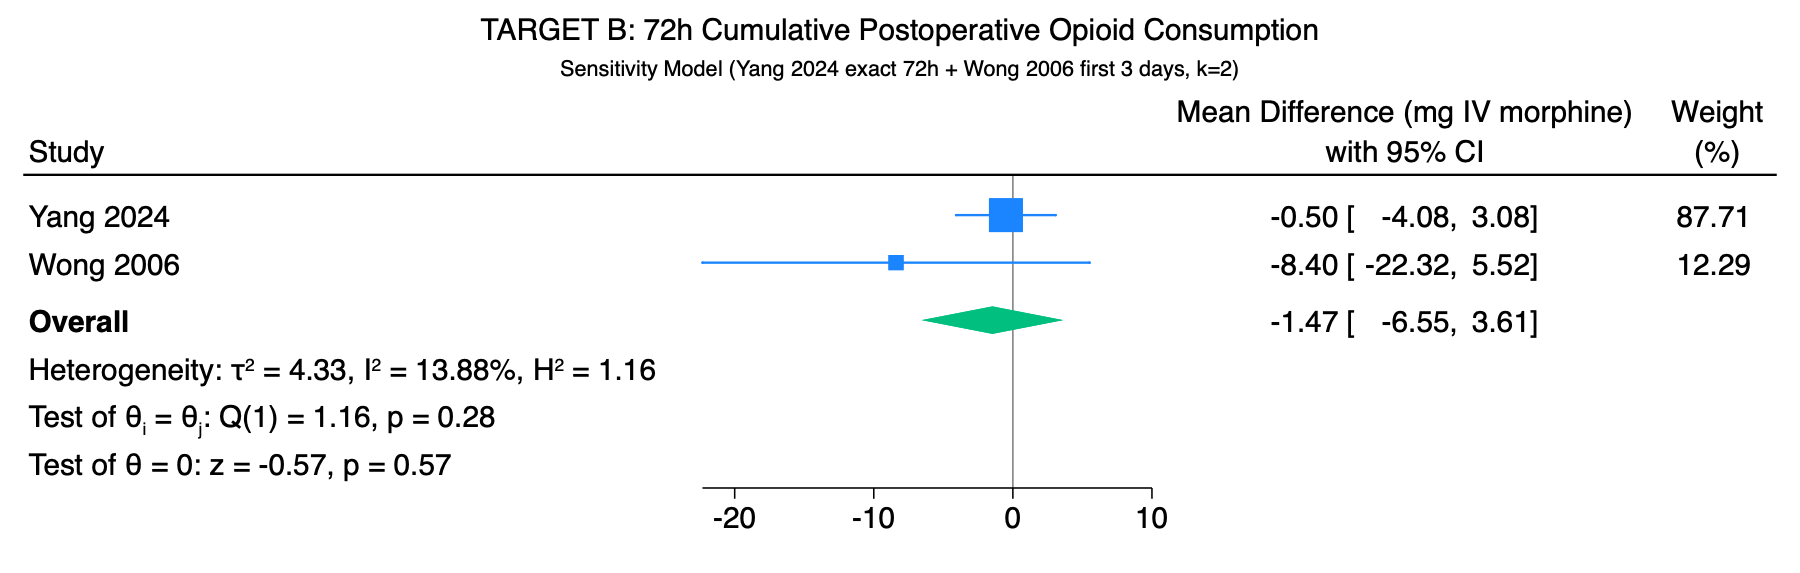
Cumulative 0–72 h opioid sparing (Strict: Single Trial Yang 2024, k = 1, N = 180 — NOT POOLED)
Executed in StataNow 19.5 BE. Strict exact 0–72h cumulative systemic opioid consumption was measured by only a single trial (Yang 2024); per Cochrane guidelines, it is not pooled.
Yang 2024 Alone (0–72h)
Broader Sensitivity (Yang + Wong)
Leave-one-out influence and sensitivity analysis
Leave-one-out influence and sensitivity analysis
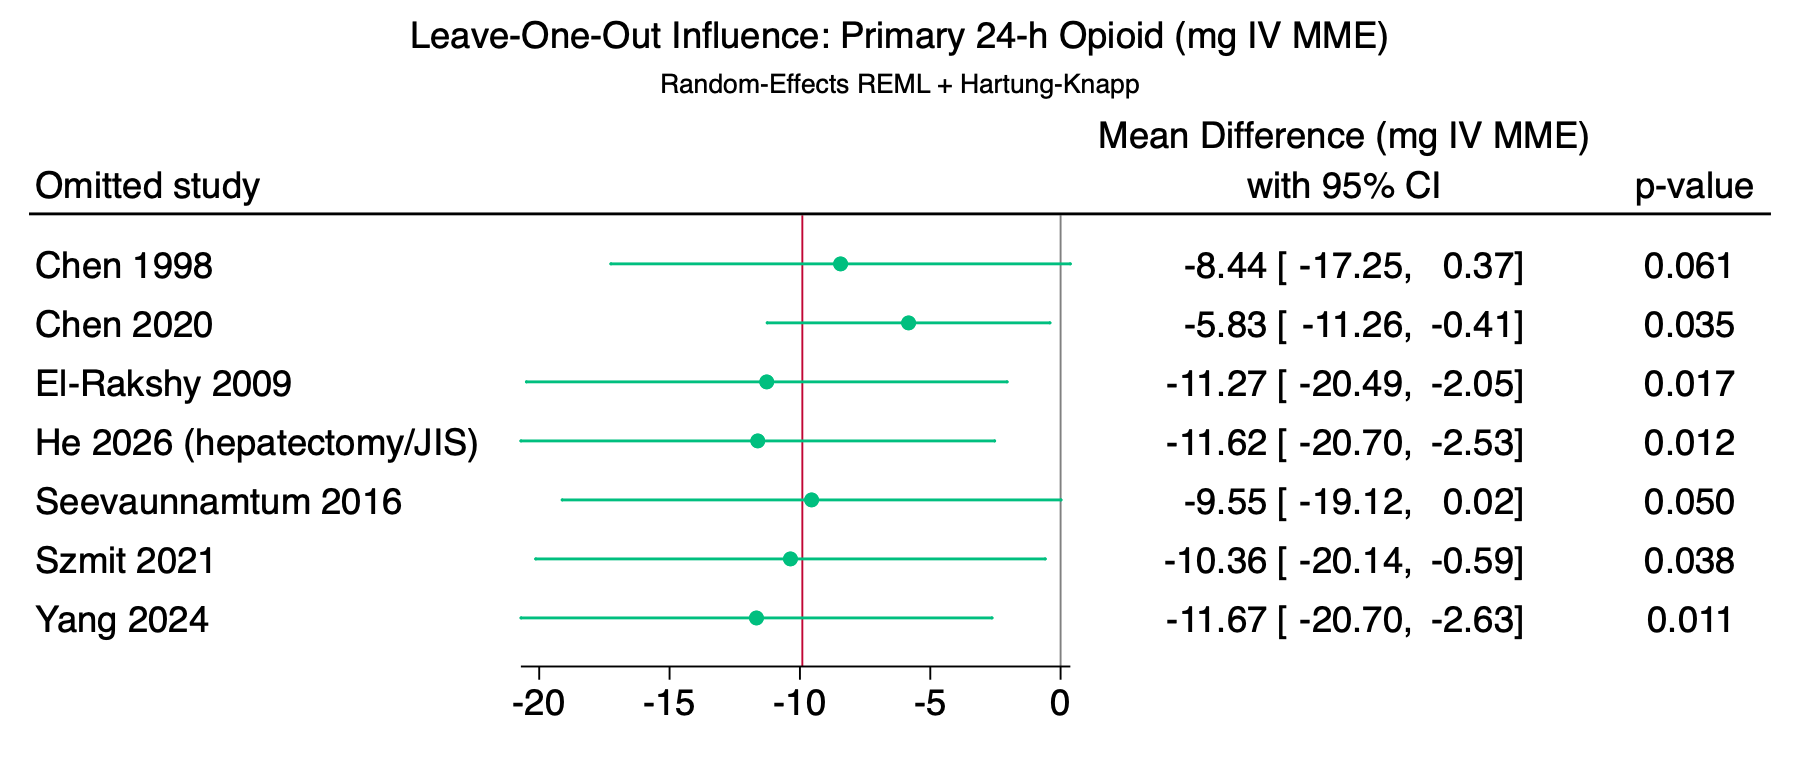
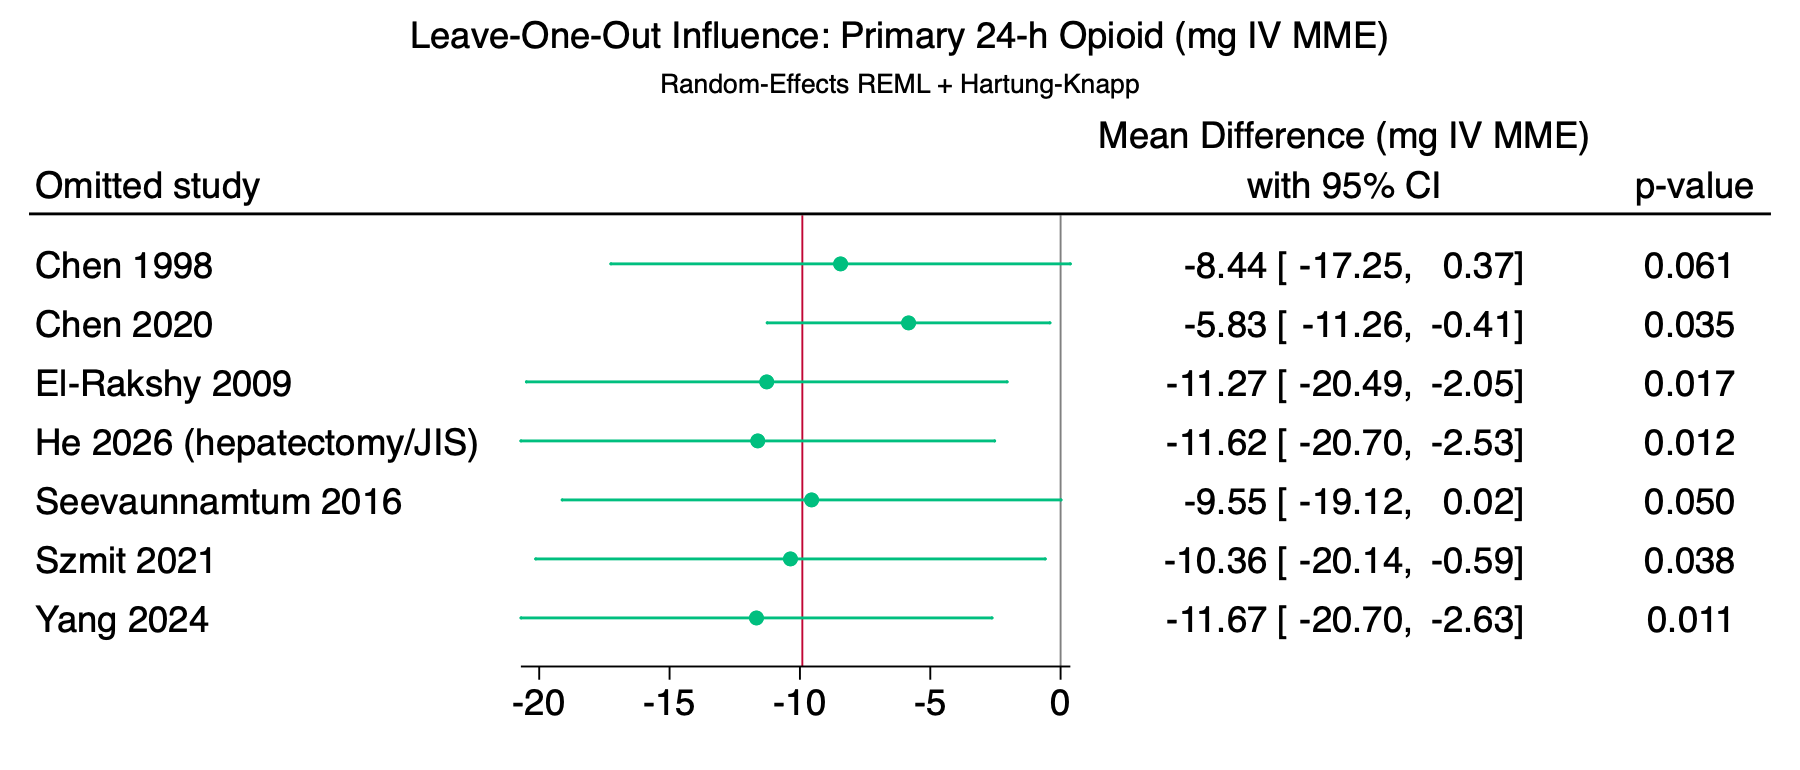
Iteratively omits each trial to evaluate whether overall statistical significance, effect direction, or heterogeneity depends on any single outlier or study artifact. Executed directly via StataNow 19.5 BE meta summarize, leaveoneout on the locked seven-trial primary dataset.
| Omitted Trial | Year | Remaining k (N) | Pooled MD (IV MME) | Wald 95% CI | Wald p | Knapp–Hartung 95% CI | KH p | τ² (Between) | I² (%) | DFBETAS |
|---|
All forest plots (12 figures)
StataNow 19.5 BE Forest Plot Gallery
Generated directly from StataNow 19.5 BE via meta forestplot for the strict primary analysis (k = 7) and the secondary/exploratory targets. Click any plot to view or download high-resolution figure.
📊 How to Read this Forest Plot
- Square/Marker: The estimated treatment effect for each study. Marker area reflects its statistical weight in the random-effects meta-analysis.
- Horizontal Line: 95% confidence interval for each study, showing uncertainty around the study estimate.
- Diamond: The pooled average treatment effect. The center indicates the point estimate and lateral tips represent the 95% confidence interval.
- Vertical Dashed Line (0 or 1): The line of no effect. For mean differences (MD), values to the left of 0 favor TEAS/EA (reduced opioid consumption or pain). For risk ratios (RR), values to the left of 1.0 favor TEAS/EA (lower complication incidence).
- Prediction Interval: The dashed/extended bracket representing the estimated range of true effects that could plausibly occur in a future study or comparable clinical setting.
Primary 24-h Opioid Sparing (IV MME mg): Strict Direct Trials (k = 7)
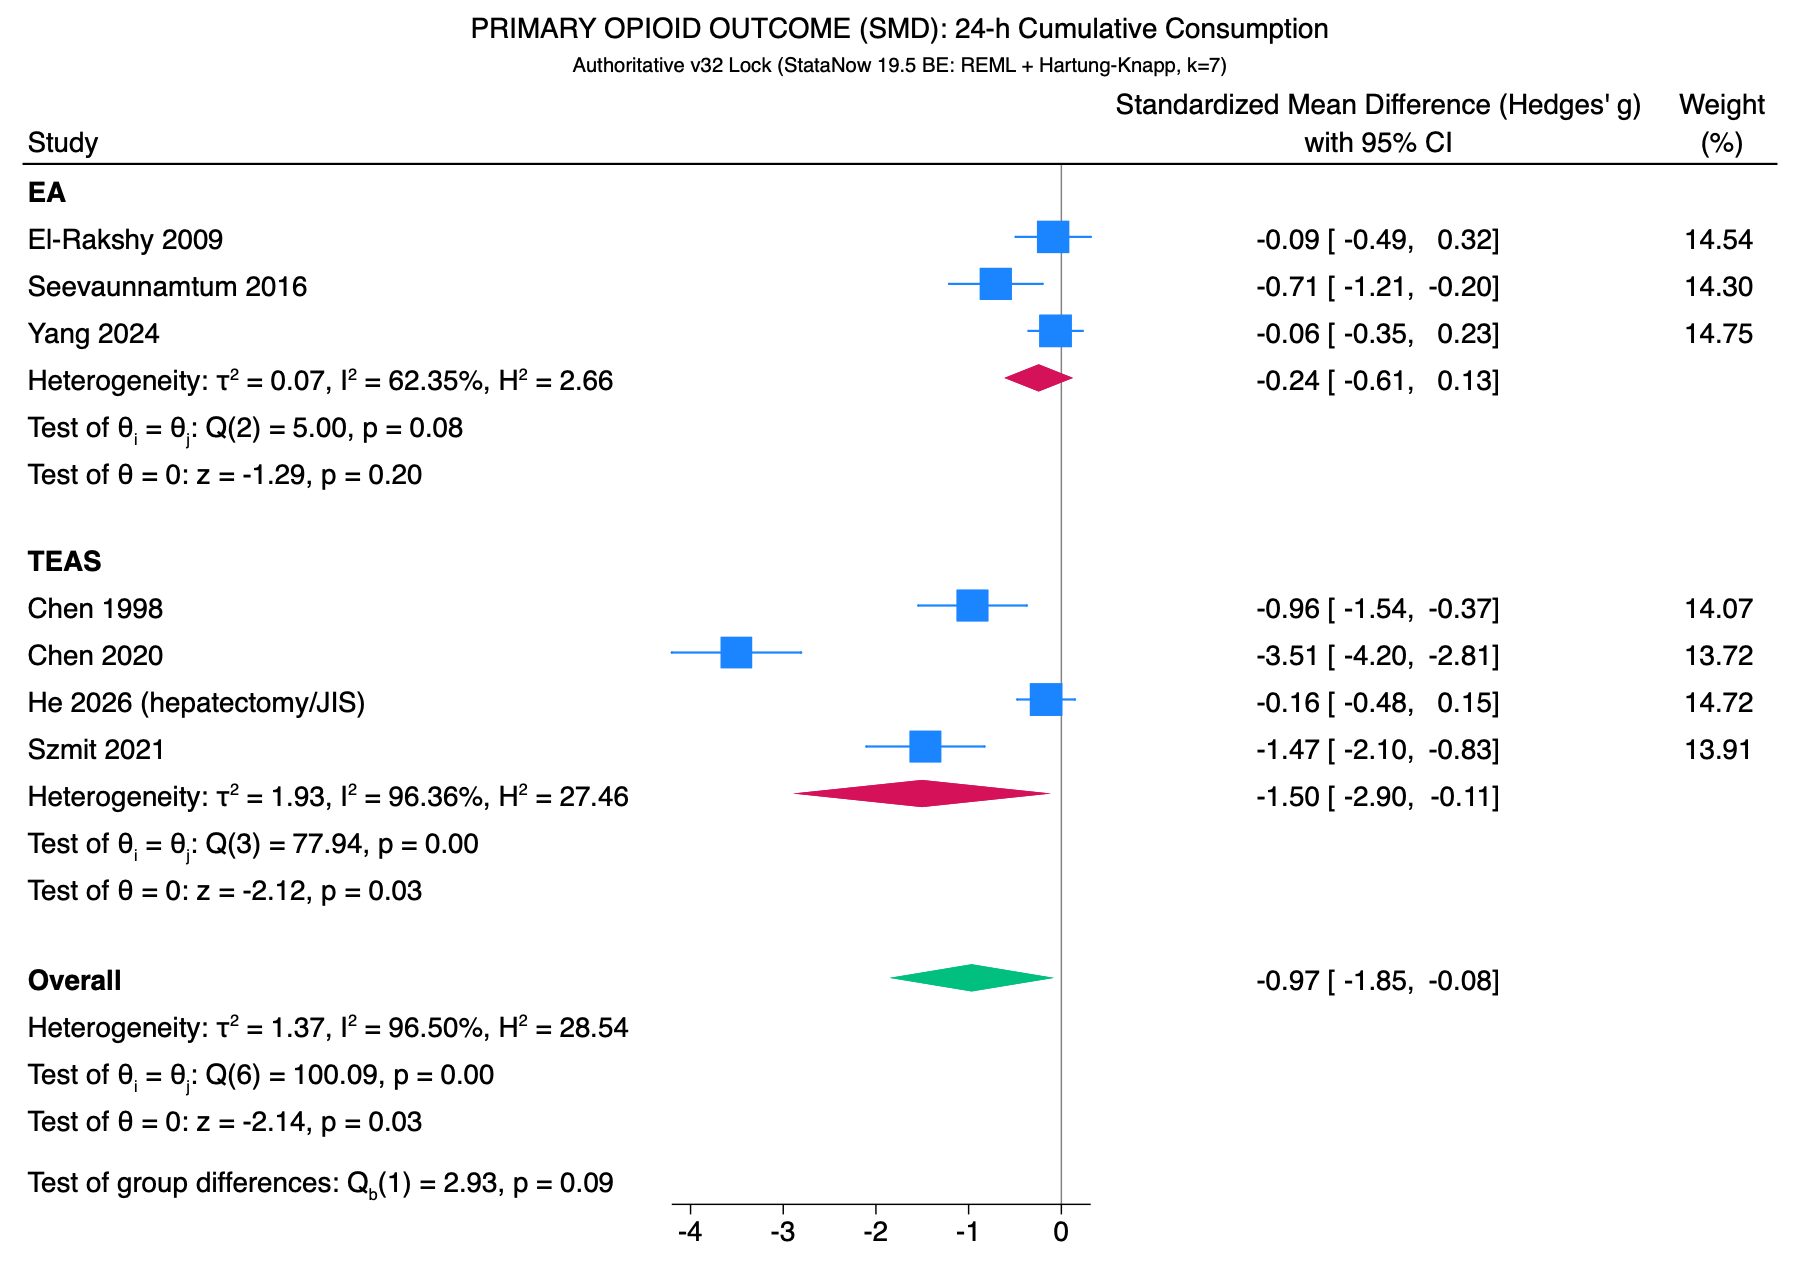
Standardized Mean Difference (Hedges' g): Primary 24-h Opioid (k = 7)
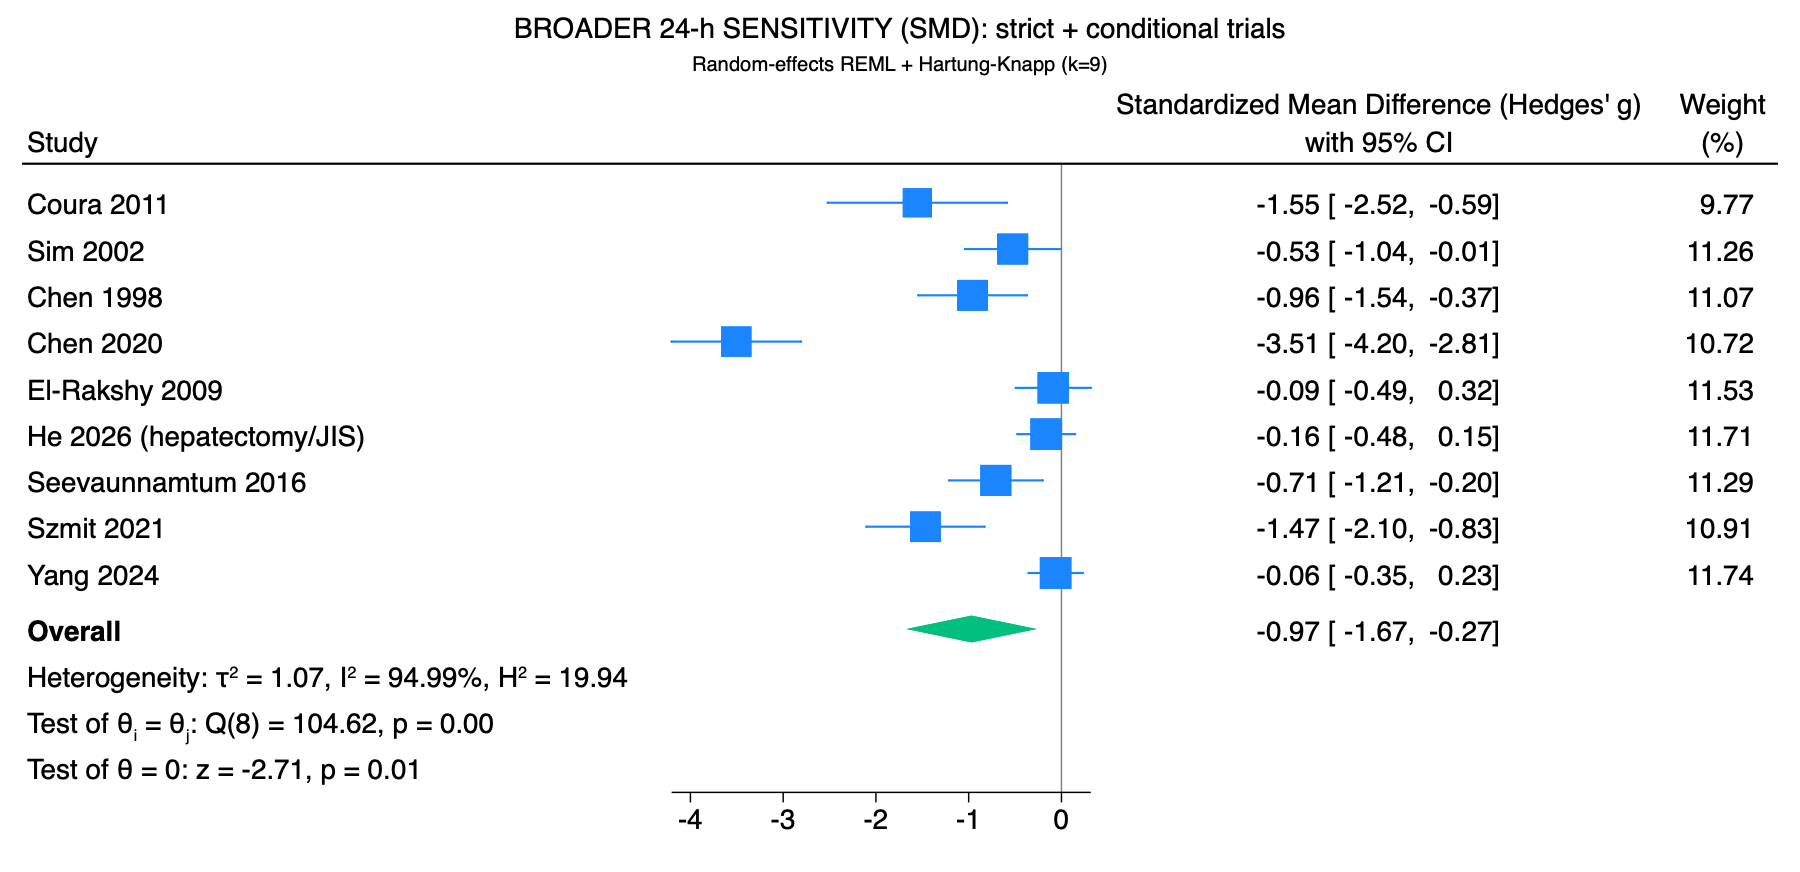
Broader 24-h Sensitivity (Hedges' g): strict + conditional trials (k = 9)
Primary 24-h Opioid Consumption Stratified by Modality (TEAS vs EA)
Target A: Cumulative 0–48h Opioid Consumption (IV MME mg)
Target B: Cumulative 0–72h Opioid Consumption
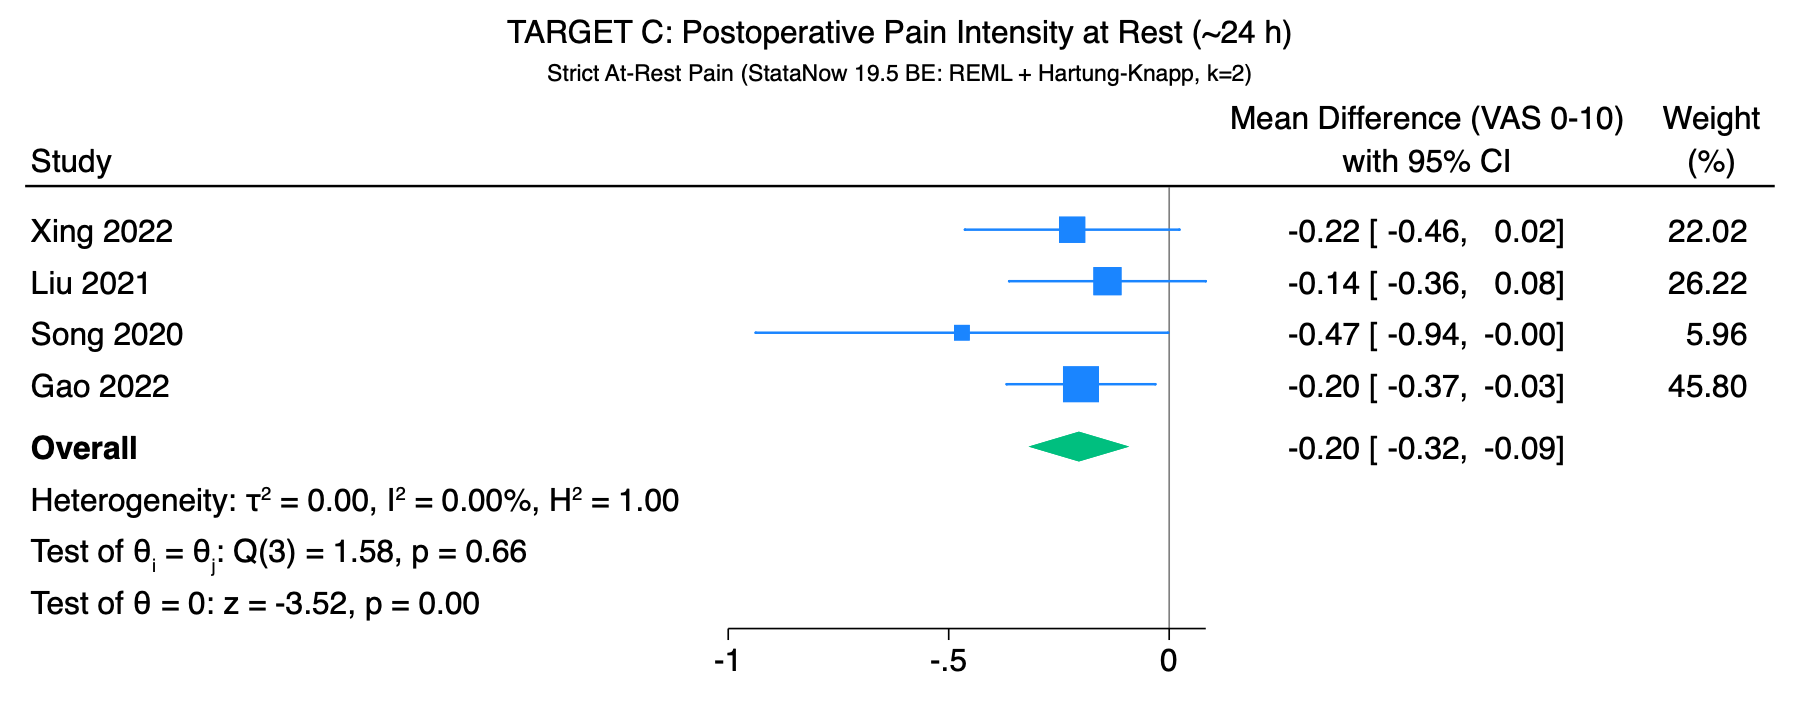
Target C: Pain Intensity at Rest Around 24h (VAS 0–10)
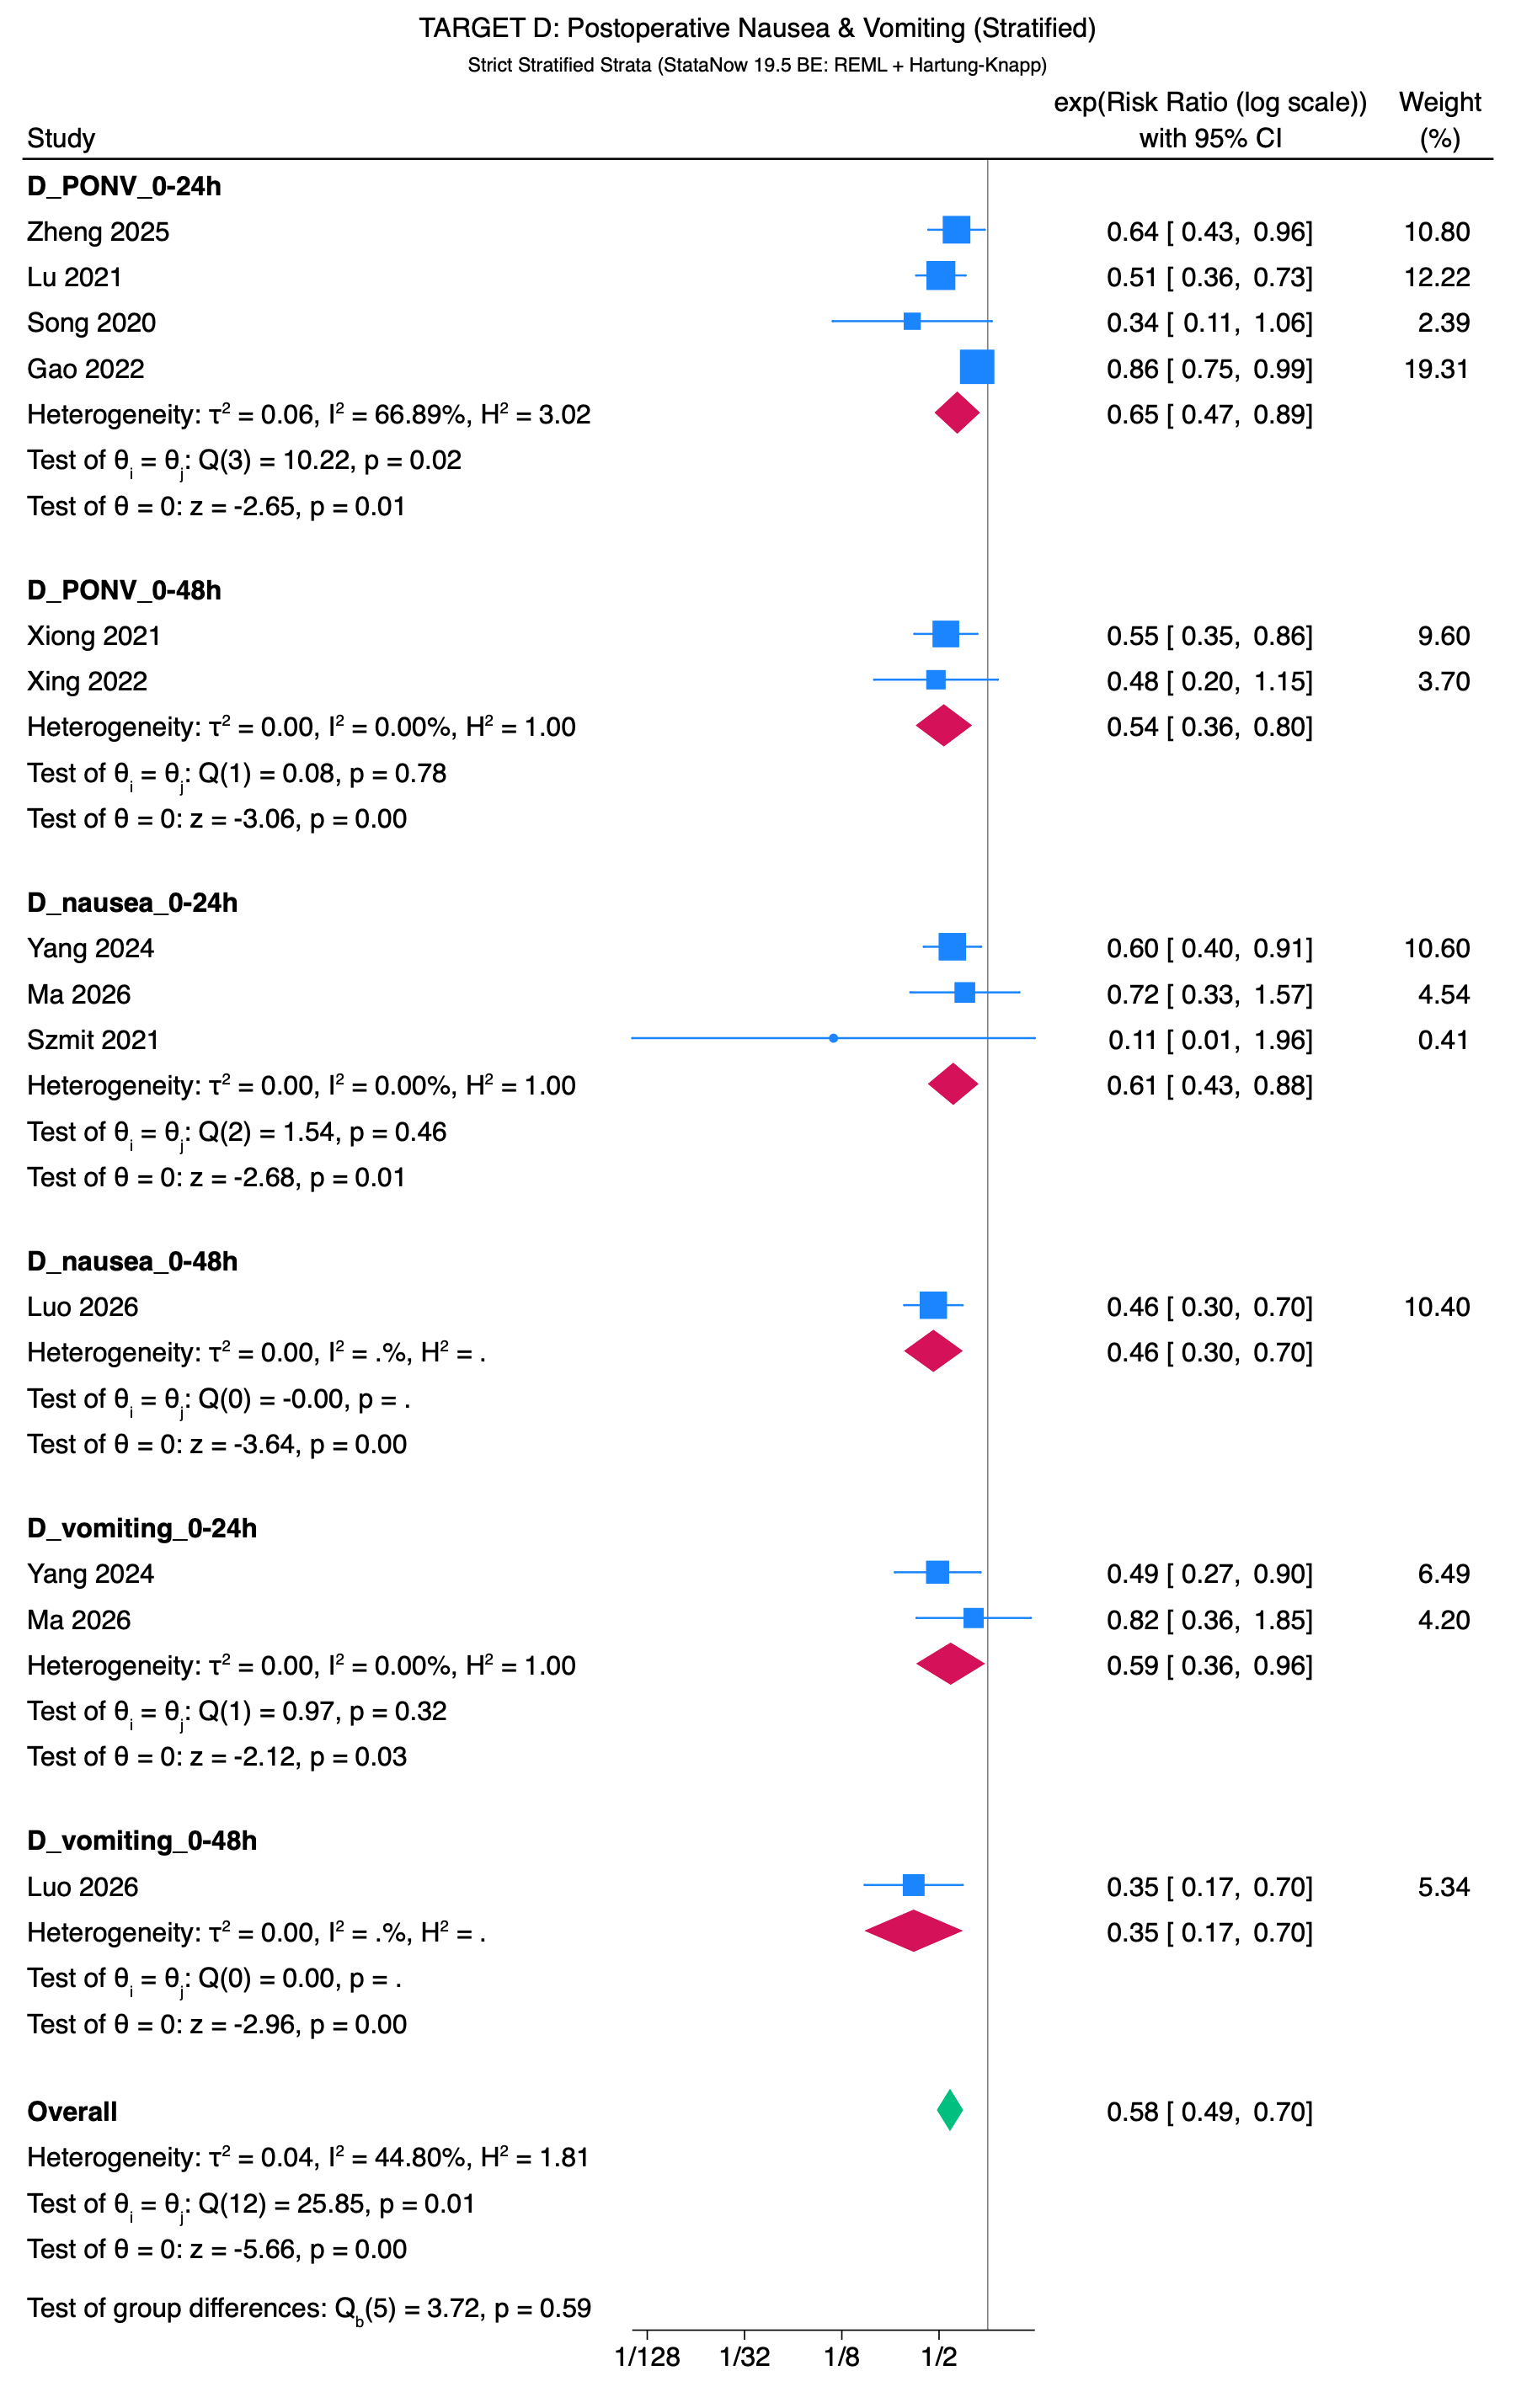
Target D: Postoperative Nausea & Vomiting (Stratified Risk Ratios)
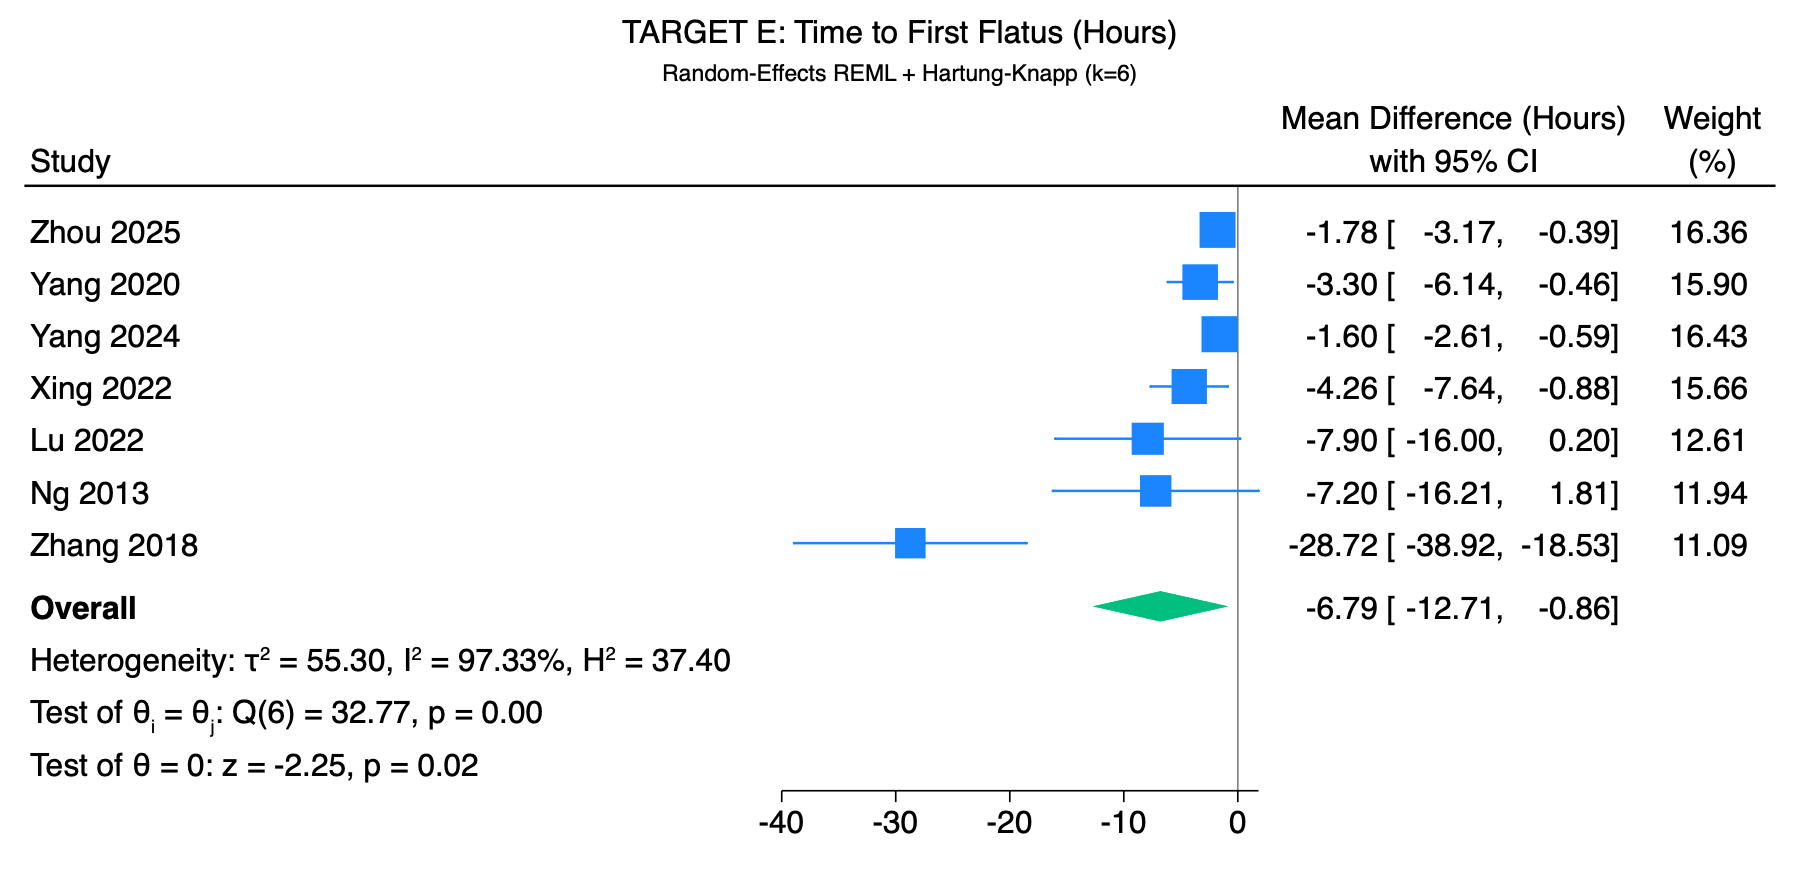
Target E: Time to First Postoperative Flatus (Hours)
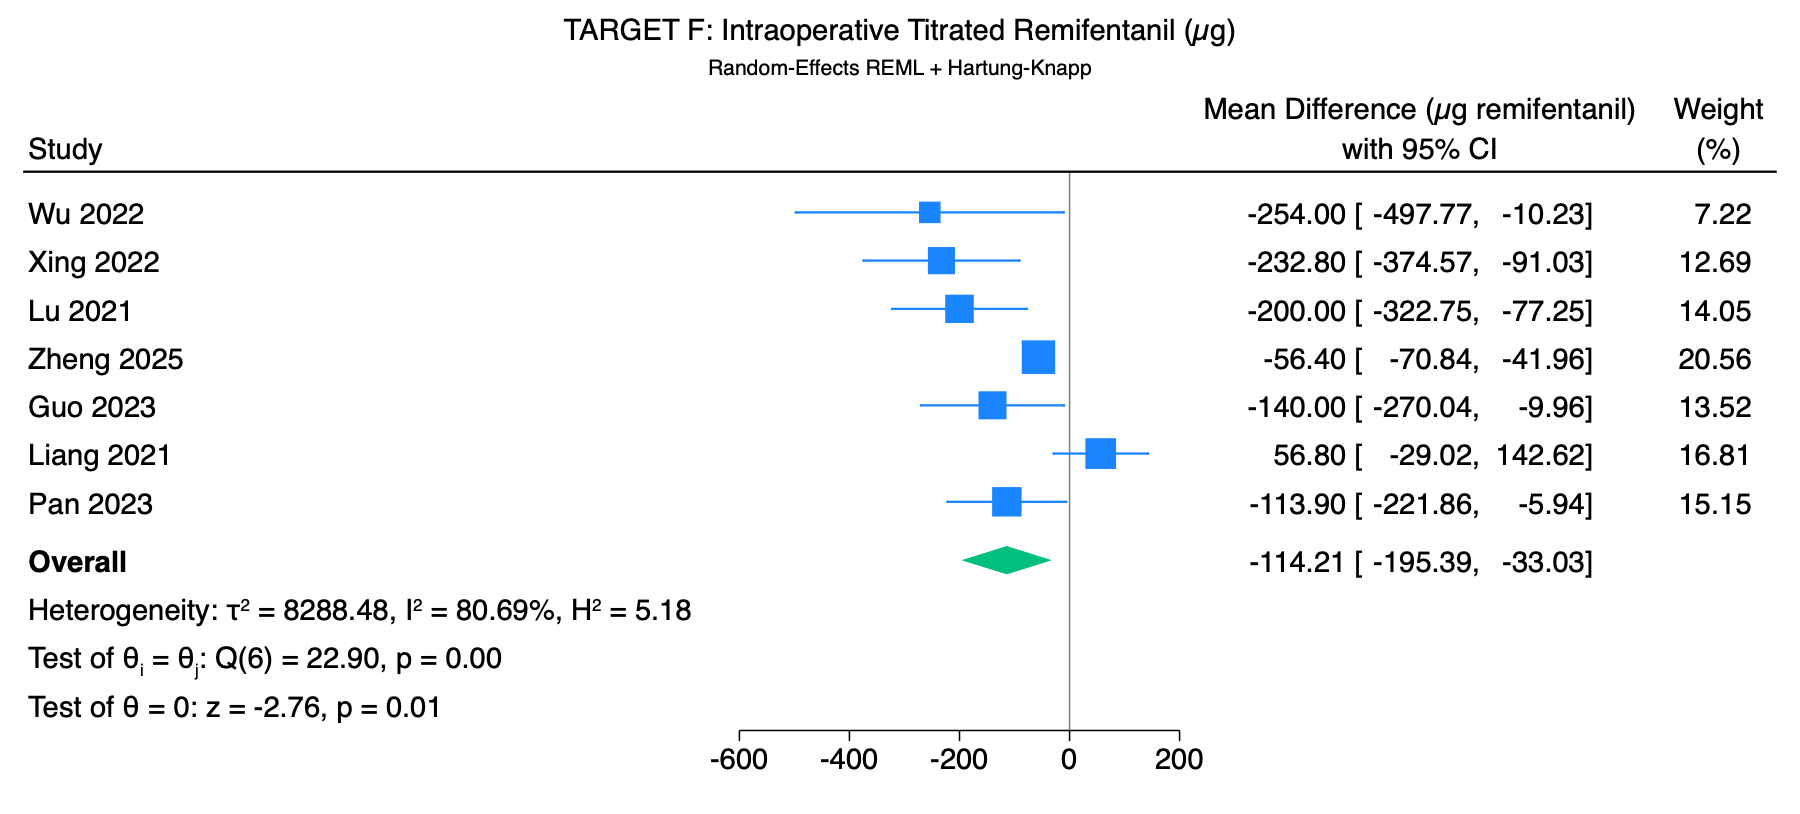
Target F: Intraoperative Titrated Remifentanil Requirement (µg)
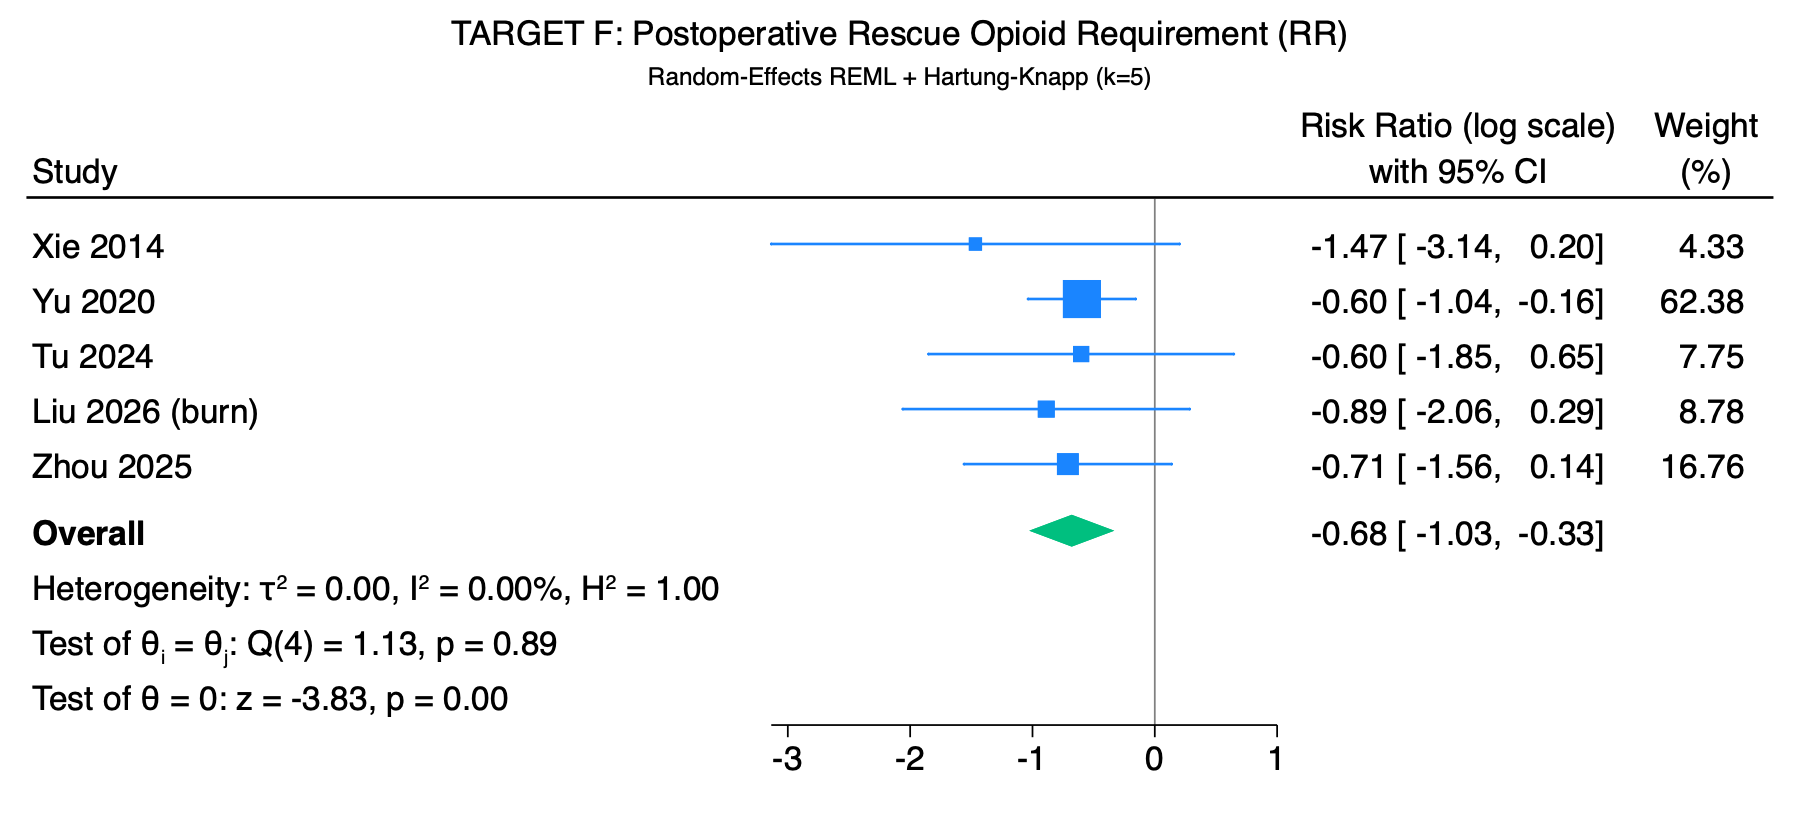
Target F: Postoperative Rescue Opioid Requirement (Risk Ratio)
Leave-One-Out Influence Diagnostics: Primary 24-h Opioid
Leave-One-Out Influence Diagnostics: Target A 48-h Opioid
Mathematical derivations and Stata weighting matrix
📐 Mathematical Derivations & Stata Calculation Breakdown
Full algebraic formulas, parametric conversions, and exact numerical matrix weights used by StataNow 19.5 BE to pool the seven strict primary trials into the primary outcome synthesis.
🔬 Part 1: Mathematical Derivations for the 5 Conditional Studies
These derivations are retained so the reasoning that once produced them stays auditable. They are not inputs to any current
pooled estimate. Two of them (Sim 2002, Coura 2011) reconstruct an absolute dose from body weight — Coura from an
assumed 70 kg the trial never reports — which the lock prohibits, so the pipeline leaves
mean_i_mme empty for both and they enter only the scale-free SMD sensitivity, computed from their native
mg/kg and µg/kg values, never from these reconstructions. Zhang 2025 was removed from every 0–24 h analysis in v33
because it reports postoperative day 1, not an explicit 0–24 h clock window. The two Chen 2015 reports are median/IQR and
are handled as a parallel synthesis, not converted to mean/SD for pooling.
Var(XY) = σ_X²·σ_Y² + μ_X²·σ_Y² + μ_Y²·σ_X²
mean_i_mme empty. Sim 2002 enters only the broader SMD sensitivity, via Hedges' g = −0.526 computed from the native mg/kg values.mean_i_mme empty. Coura 2011 enters only the broader SMD sensitivity, via Hedges' g = −1.553 computed from the native µg/kg values, which needs no weight at all.MME = Dose_sufentanil × 1.0 mg/µg (1000:1, corrected 2026-09-07)
06_AUDIT/opioid_conversion_audit.csv; the Stata pipeline leaves mean_i_mme missing and inc_primary = 0, so this trial contributes to no MME pool.📊 Part 2: StataNow 19.5 BE Random-Effects Weighting Matrix (Strict Clean Trials: k = 7, N = 676)
| Study & Year | Modality / Comparator | Data Status | Sample ($n_1 / n_2$) | Mean Diff $y_i$ | Std Error $SE_i$ | Variance $v_i$ | Fixed Weight $w_i$ | Stata REML Weight (%) | Stata DL Weight (%) | Hedges' $g$ (SE) |
|---|---|---|---|---|---|---|---|---|---|---|
| Chen 1998 | TEAS vs Sham | Direct | 25 / 25 | −21.000 mg | 6.103 mg | 37.247 | 0.0268 | 11.69% | 10.50% | −0.958 (0.299) |
| Chen 2020 | TEAS vs Sham | Direct | 40 / 40 | −28.190 mg | 1.781 mg | 3.172 | 0.3152 | 15.09% | 15.48% | −3.505 (0.356) |
| El-Rakshy 2009 | EA vs Control | Direct | 42 / 53 | −1.600 mg | 3.719 mg | 13.827 | 0.0723 | 13.83% | 13.48% | −0.088 (0.207) |
| He 2026 (hepatectomy/JIS) | TEAS vs Sham | Direct | 80 / 79 | −0.600 mg | 0.578 mg | 0.334 | 2.990 | 15.47% | 16.12% | −0.164 (0.159) |
| Seevaunnamtum 2016 | EA vs Usual Care | Direct | 32 / 32 | −12.560 mg | 4.389 mg | 19.263 | 0.0519 | 13.27% | 12.65% | −0.707 (0.258) |
| Szmit 2021 | TEAS vs Sham | Direct | 24 / 24 | −7.700 mg | 1.491 mg | 2.224 | 0.4496 | 15.21% | 15.69% | −1.466 (0.325) |
| Yang 2024 | EA vs Usual Care | Direct | 90 / 90 | −0.300 mg | 0.716 mg | 0.513 | 1.951 | 15.44% | 16.08% | −0.062 (0.149) |
| StataNow 19.5 BE Primary Random-Effects Synthesis (Strict k = 7, N = 676) | REML: −9.907 mg | SE(KH): 4.157 mg | Cochran Q = 254.61 (p < 0.0001) | 100.0% (τ² = 113.91, I² = 98.57%) | DL: −9.726 mg (τ² = 68.51) | g = −0.967 (p = 0.079) | ||||
Statistical Deferral of Multivariable Meta-Regression
The 10:1 Rule for Meta-Regression: Cochrane Handbook Section 10.11.4.1 advises that meta-regression generally should not be considered with fewer than approximately 10 studies per candidate predictor/covariate, and more may be required depending on the covariate's distribution, to avoid severe overfitting and spurious ecological associations.
Stata execution log
StataNow 19.5 BE Consensus Execution Log
Loading Stata 19.5 execution stream...
Multivariable meta-regression is not available
There are too few strict primary studies for a reliable multivariable model. This tab contains the saved modality comparison and exploratory single-moderator analysis. No interactive prediction tool is available.
StataNow 19.5 BE Meta-Regression & Moderator Studio
Investigating sources of between-study clinical and statistical heterogeneity (τ²) across the strict primary trials (k = 7, N = 676). No expanded exploratory pool is reported. Under the Cochrane 10:1 rule of thumb (§10.11.4), k = 7 trials is underpowered for inferential multivariable meta-regression; univariable modality comparison (TEAS vs EA: difference −9.32 mg, p = 0.308) is exploratory. Egger's test for publication bias was not performed due to k < 10.
- Strict Primary Clean Sample (k = 7, N = 676): With k = 7 trials, meta-regression is formally underpowered per the Cochrane 10:1 ratio recommendation. Univariable exploration of modality (TEAS vs EA: β = −9.32 mg [−30.44, +11.79], p = 0.308) reveals no statistically significant moderator effect. Publication bias testing via Egger linear regression was not performed because k < 10.
- Withdrawn: expanded k = 11 moderator cohort. Earlier releases of this dashboard reported univariable baseline-opioid-demand (β = −0.170, p = 0.0186) and publication-year (β = +0.471, p = 0.0287) meta-regressions, plus a multivariable model, fitted to an 11-trial pool. That pool is not the v26 primary analysis set: it mixed conditional, proxy and excluded records, and counted the overlapping Yeh 2010 / Yeh 2011 lumbar-spine reports as two independent trials. Those models are not reproduced by the locked v26 pipeline and have been withdrawn rather than restated.
- Multivariable & higher-order models are not reported. With k = 7 no multivariable meta-regression is estimable at acceptable risk of overfitting, collinearity (ecological fallacy) and inflated Type I error. None is presented, in any form, including as “sensitivity context”.
Primary 24-h Opioid Consumption by Modality (k = 7)
Random-effects REML with Knapp–Hartung adjustment, stratified by modality. Generated by
06_FINAL_ANALYSIS_V26/02_STATA/09_subgroups_metareg.do.
meta summarize, random(reml) se(kh) subgroup(modality)
This panel previously offered five interactive meta-regression bubble plots (baseline opioid demand, publication year, sex composition, and TEAS/EA strata) fitted to an 11-trial pool.
That pool is not the v26 primary analysis set. It included conditional, proxy-endpoint and excluded records, and counted the overlapping Yeh 2010 / Yeh 2011 lumbar-spine reports as two independent trials, which the v26 lock explicitly forbids. Its stated EA stratum (Sim 2002, Coura 2011, El-Rakshy 2009) is also not the v26 EA stratum (El-Rakshy 2009, Seevaunnamtum 2016, Yang 2024).
None of those models is reproduced by the locked v26 pipeline, so they have been removed rather than restated. With k = 7 the only defensible presentation is the stratified subgroup figure shown here, plus the single underpowered modality meta-regression reported above.
Comprehensive Moderator & Clinical Parameter Matrix (k = 7 Strict Primary RCTs)
Descriptive audit of candidate moderators across the seven strict primary trials. No coefficient in this matrix is an inferential meta-regression result: with k = 7 the Cochrane 10:1 rule is not met, so this table documents what could be examined and why it was not modelled.
| Moderator Domain | Variable Type | Empirical Distribution | Meta-Regression β [95% CI] | Model Test (Knapp–Hartung) | Variance Explained (R²) | Methodological Assessment | Clinical & Analytical Interpretation |
|---|---|---|---|---|---|---|---|
| Baseline Opioid Demand | Continuous Clinical | Control Mean: 5.3 to 114.1 mg | Not estimated | Not estimated | — | Not modelled (k = 7) | Baseline demand varies widely across the strict primary trials, so it is a plausible source of heterogeneity. It is not modelled: k = 7 is below the Cochrane 10:1 threshold. A previously displayed slope (β = −0.170, p = 0.0186) came from the withdrawn 11-trial pool and is not reproduced by v26. |
| Publication Year | Continuous Temporal | Year: 1998 to 2026 | Not estimated | Not estimated | — | Not modelled (k = 7) | Not modelled in the locked primary analysis. A previously displayed secular trend (β = +0.471 per year, p = 0.0287) came from the withdrawn 11-trial pool. Possible explanations for a genuine trend would include changes over time in multimodal analgesia, perioperative practice, surgical case mix, comparator treatment, study methodology, or other secular trends. This analysis cannot determine the cause. |
| Modality (EA vs TEAS) | Binary Intervention | TEAS (k = 4) vs EA (k = 3) | −9.32 mg [−30.44, +11.79] | p = 0.308 (REML + Knapp–Hartung) | — | Univariable only • underpowered | The only meta-regression fitted in the locked primary analysis (09_subgroups_metareg.do). No evidence of a modality difference; with k = 7 this is exploratory and cannot exclude a clinically relevant difference. No multivariable adjustment is reported. |
| Stimulation Timing | Categorical Protocol | Preoperative/intraoperative-phase (k = 6/7); Postoperative-only (k = 1/7, Szmit 2021) | Not estimated | Szmit 2021 (added 2026-09-07) applies TEAS entirely postoperatively (30 min every 2 h through 24 h), unlike the other six trials, so this covariate is no longer constant. It is not modelled: k = 7 with a 6-vs-1 split is far below the Cochrane 10:1 threshold and severely imbalanced. A previously displayed categorical model (Preoperative k=5 vs Multi-phase k=5 vs Intraop k=1, summing to 11) came from the withdrawn 11-trial pool and does not describe this set either. | |||
| Electrical Frequency | Categorical Protocol | 100% 2/100 Hz Dense-Disperse (k = 7/7) | Dropped by Stata due to zero variance (constant across trials) | All seven strict primary trials used the 2/100 Hz dense-disperse waveform (Szmit 2021, added 2026-09-07, alternates the same 2/100 Hz pattern); the covariate has no variance, so frequency cannot be tested. A previously displayed categorical model (2/100 Hz DD k=7 vs Fixed 100/2 Hz k=4, summing to 11) came from the withdrawn 11-trial pool and does not describe this set either. | |||
| Number of Sessions | Discrete Protocol | Single-session (k = 6/7); Repeated sessions (k = 1/7, Szmit 2021) | Not estimated | Szmit 2021 (added 2026-09-07) delivers repeated 30-min sessions every 2 h through 24 h, unlike the other six single-session trials, so this covariate is no longer constant. It is not modelled: k = 7 with a 6-vs-1 split is far below the Cochrane 10:1 threshold and severely imbalanced. | |||
| Patient Sex (% Female) | Demographic (Aggregate) | Range: 22.1% to 100.0% female | Not estimated | Not estimated | — | Ecological Fallacy | Not modelled; k = 7 is insufficient for reliable study-level meta-regression on a continuous demographic moderator. No association can be affirmed or ruled out from this evidence, and study-level aggregates could not establish individual-level effects in either direction (ecological fallacy). |
| Patient Age & BMI | Demographic (Aggregate) | Study mean age: 45 to 58 yrs | Clustered study means • Individual Participant Data (IPD) required | Study-level averages cannot evaluate patient-level age/weight effects due to Simpson's paradox. | |||
| Acupoint Selection | Anatomical Prescription | Bundled somatic points (LI4, PC6, ST36, SP6) | High collinearity • Multi-point co-administration | Acupoints are always prescribed as bundles; isolating single acupoint efficacy in aggregate data is impossible. | |||
In meta-regression, demographic variables like patient age, BMI, and sex are reported as study-level aggregates (e.g. trial mean age = 52.4). Meta-regression cannot assess whether an individual 75-year-old achieves greater sparing than a 25-year-old. Testing aggregate means risks the Ecological Fallacy (Simpson's Paradox), where cross-study associations contradict true patient-level effects. True evaluation of age, BMI, and comorbidities strictly requires Individual Participant Data (IPD) meta-analysis.
In accordance with STRICTA guidelines, acupoints in perioperative anesthesia trials are virtually never tested in isolation. They are delivered as standard multi-channel somatic prescriptions combining upper-limb segmental points (LI4 Hegu, PC6 Neiguan) and lower-limb visceral points (ST36 Zusanli, SP6 Sanyinjiao). Because trials share the same point combinations, statistical collinearity prevents isolating the independent contribution of any single acupoint in study-level meta-regression.
Interactive Effect-Modifier Simulator — Removed
This panel previously let readers slide a baseline-opioid-demand value and a modality toggle
through the multivariable model
MD = 0.0204 − 0.1876 × (Baseline Demand) + 1.4895 × (EA),
returning a point estimate and a confidence interval.
That model was fitted to the withdrawn 11-trial pool, is not reproduced by the locked primary pipeline, and could not be defended at k = 7: two covariates on seven studies is far below the Cochrane 10:1 threshold, and the interval it displayed was produced by an approximation rather than by the model's covariance matrix. Presenting it as an interactive predictor invited exactly the individual-patient reading that the accompanying ecological-fallacy warning disclaimed.
The authoritative moderator evidence is the modality subgroup pair and the single underpowered modality meta-regression reported at the top of this tab. No predictive instrument is offered in its place.
Verbatim Execution Log: v26 Subgroup & Meta-Regression Audit
Loading Stata meta-regression execution stream...
Limitations and author clarification records
Review the catalogued requests for missing or unclear study data and their recorded dispositions. The hypothetical sensitivity tool explores changes to existing primary results; it does not represent author responses.
⚠️ Limitations of this review
Author Outreach & Data Clarification Center
No author reply is required to finalize this review. All 19 P1 issues carry a recorded disposition in the v26 lock (AF_P1_Disposition) and none is a global final-lock blocker. Eighteen were resolved analytically — by the source hierarchy, a raw/native-data rule, exclusion, partial exclusion, timepoint exclusion, field exclusion, stratification, mandatory sensitivity, or narrative-only reporting. One remains a hard hold: the Yeh 2010 / Yeh 2011 lumbar-spine cohort-overlap question (P1-01), which is handled by excluding both reports from pooling rather than by waiting on correspondence. The roster below is retained as a provenance record of which clarifications were sought and how each was dispositioned — not as a queue of outstanding replies.
Primary 24-h Opioid Consumption Missing
Secondary Pain SDs, Vomiting Counts & GI Metrics
Cohort Overlap & Metric Verification (19 P1s Dispositioned)
window.P1_DISPOSITIONS. Primary 24-h opioid locked at k=7, N=676; Target A locked at k=3, N=1,999; Target E flatus locked at k=7, N=638 (k=6, N=596 before Zhang 2018 was admitted 2026-09-12).
🔬 Hypothetical Sensitivity on Existing Primary Trials
Author Clarification Roster & Disposition Record (60 catalogued inquiries, 0 outstanding blockers)
Click "📋 Copy Email" to copy the ready-to-send draft letter directly to your clipboard, or click the email address to open your mail client.
| Study Identifier | Priority | Target Data Requested | Corresponding Author & Institution | Contact Email | Action |
|---|
📐 Opioid Conversion Methodology & Literature Reference Hub
Prespecified equianalgesic conversion framework used for harmonization to a common IV morphine-milligram-equivalent (IV MME) metric, with uncertainty assessed in sensitivity analyses where a factor is not independently verified. See 06_FINAL_ANALYSIS_V26/06_AUDIT/opioid_conversion_audit.csv for the full per-drug audit.
Transparent mathematical formulations, clinical pharmacology equianalgesic conversion factors, and peer-reviewed literature citations underpinning all converted values in this systematic review.
| Opioid Drug & Route | Conversion Factor to IV MME | Equianalgesic Dose (10 mg IV Morphine) | Clinical Pharmacology & Receptor Rationale | Foundational Guidelines & References |
|---|---|---|---|---|
| Morphine (IV) | 1.0 mg / mg | 10.0 mg | Reference standard opioid comparator (self-referential by definition). Pure $\mu$-opioid receptor agonist. | ANZCA APM:SE 2020 |
| Sufentanil (IV) ✓ CORRECTED 2026-09-07 | 1.0 mg MME / µg (1000:1) | 100.0 µg (0.10 mg) |
Corrected 2026-09-07. Previously applied at 0.1 mg MME/µg (100:1) — identical to the fentanyl ratio below and uncited. Now 1.0 mg MME/µg (1000:1): BC Ministry of Health equianalgesic table gives sufentanil 0.01–0.04 mg (10–40 µg) = morphine 10 mg parenteral (250:1–1000:1), and the FDA sufentanil label states it is “as much as 10 times as potent as fentanyl” in balanced general anaesthesia (5–7× as a sole agent), which with fentanyl at 100:1 gives 500:1–1000:1. Residual uncertainty is carried as a published sensitivity range (0.1 / 0.25 / 0.5 / 1.0). See 06_AUDIT/opioid_conversion_audit.csv. |
BC MoH equianalgesic table / FDA sufentanil label |
| Fentanyl (IV) | 0.10 mg MME / µg (100:1) | 100.0 µg (0.10 mg) | Rapid-onset synthetic $\mu$-agonist; commonly cited 100:1 equianalgesic ratio with IV morphine in postoperative PCA regimens. Consistent between the Stata pipeline and this table (An 2014). | ANZCA 2020 / Nielsen 2016 |
| Remifentanil (IV) | 0.10 mg MME / µg (100:1) | 100.0 µg (0.10 mg) | Ultra-short-acting esterase-metabolized $\mu$-agonist; evaluated in intraoperative consumption endpoints ($1\,\mu\text{g} = 0.1\text{ mg}$ IV MME). Not independently re-verified in this audit pass. | ASA Practice Guidelines 2012 |
| Hydromorphone (IV) | 5.0 mg MME / mg | 2.0 mg | Semisynthetic hydrogenated ketone of morphine. BC Ministry of Health equianalgesic table: hydromorphone 2 mg parenteral = morphine 10 mg parenteral (5:1). Some tables (University of Toronto) use 1.5 mg, giving 6.67:1; the published parenteral range is 5:1–6.67:1 and this project uses 5:1. Affects Chen 1998 only. | BC MoH equianalgesic table |
| Oxycodone (IV) | 1.0 mg MME / mg | 10.0 mg | Parenteral formulation administered in European/Asian surgical trials; equipotent to intravenous morphine on a milligram-for-milligram basis. | Treillet 2018 / ANZCA 2020 |
| Dezocine (IV) | 1.0 mg MME / mg | 10.0 mg | Synthetic opioid partial $\mu$-agonist / $\kappa$-antagonist widely used in China; clinical trials establish near 1:1 equianalgesic potency to IV morphine. | Chinese Pain Society Consensus / Liu 2020 |
| Pethidine / Meperidine (IV) NOT APPLIED IN ANY ANALYSIS | 0.10–0.13 mg MME / mg | 75.0 – 100.0 mg | Synthetic opioid; 75–100 mg parenteral pethidine is commonly stated as equivalent to 10 mg parenteral morphine. Attribution corrected 2026-09-12. This row previously cited ANZCA 2020 / Knotkova 2012. Neither citation supports it: the ANZCA APM:SE 2020 entry in the reference pane below is applied in this review to intravenous sufentanil, fentanyl, oxycodone and hydromorphone, and pethidine is not among them; Knotkova 2012 appears nowhere in this repository except as this badge and the butorphanol badge — it has no reference-pane entry, and 06_AUDIT/opioid_conversion_audit.csv had already recorded it as “also uncited in-repo” during the 2026-09-07 sufentanil audit. No factor for pethidine exists in 00_prep_data.do and none is applied to any trial. Oztas 2019 reports rescue pethidine 20.66 ± 27.89 vs 33.12 ± 42.69 mg, and it is held out for a second and independent reason: it cannot be added to that trial's PCA tramadol, because the SD of a within-person sum needs a covariance the trial does not report. |
No attribution verified in this repository |
| Tramadol (IV) NOT APPLIED IN ANY ANALYSIS | 0.10 mg MME / mg | 100.0 mg | Attribution withdrawn 2026-09-12; no ratio is adopted. This row previously cited ANZCA 2020 / Treillet 2018 for 0.10. Neither citation supports it: the ANZCA APM:SE 2020 entry is applied here to sufentanil, fentanyl, oxycodone and hydromorphone, and the Treillet 2018 entry to the 1000:1 sufentanil ratio — tramadol appears in neither. A dedicated search (2026-09-07 against this project's reference family, repeated 2026-09-12 against the published literature) located no citable parenteral tramadol:morphine ratio, and the reason is pharmacological rather than bibliographic: MME is defined on $\mu$-receptor agonist activity, whereas tramadol is a weak $\mu$-agonist and a serotonin–noradrenaline reuptake inhibitor whose analgesia depends on CYP2D6-mediated activation to O-desmethyltramadol, so a single equivalence number does not carry the same meaning for it as for a pure $\mu$-agonist. The figure is retained here only as the clinically quoted approximation it is, marked as applied to nothing. It gates no evidence: the one trial reporting tramadol, Oztas 2019 (0–24 h PCA tramadol 228.40 ± 87.89 vs 357.81 ± 123.70 mg), enters the review on the scale-free route instead, where the unit cancels — Hedges' g = −1.168 [−1.930, −0.406], V33_TIERE_TEAS_USUAL_SMD, native mg with no conversion applied. |
No sourced ratio located; none adopted |
| Butorphanol (IV) | 5.0 mg MME / mg | 2.0 mg | Mixed agonist-antagonist; 2 mg IV butorphanol is clinically equianalgesic to 10 mg parenteral morphine. | ANZCA 2020 / Knotkova 2012 |
Scope of this table, recorded 2026-09-12.
Four of these factors are actually applied to trial data: morphine 1.0 (self-referential), hydromorphone 5.0, sufentanil 1.0 mg MME/µg, and fentanyl 0.10 mg MME/µg. They are the only mme_factor assignments in 06_FINAL_ANALYSIS_V26/02_STATA/00_prep_data.do, alongside a factor of 1.0 for two trials whose authors supply their own MME figure. Every other row is reference material that no estimate in this review depends on. Three attributions on those reference-only rows remain unverified against a source held in this repository and are flagged rather than silently kept: Nielsen 2016 (fentanyl row, as a second citation beside ANZCA 2020), and Chinese Pain Society Consensus / Liu 2020 (dezocine) have no reference-pane entry; Knotkova 2012 (butorphanol) has none either, and the two rows that leant on it hardest have been corrected above. Where a badge names no reference-pane entry but the cell text itself gives a specific, checkable locator — the BC Ministry of Health palliative equianalgesic table and the FDA sufentanil label, both recorded in 06_AUDIT/opioid_conversion_audit.csv — the attribution stands.
Preserve the Reported Statistics
This review does not convert median/IQR to mean/SD for pooling. Record the median, dispersion, native units and source location, and keep this evidence separate from mean/SD analyses.
The Wan, Luo and Shi publications listed in the literature pane are historical methodological references. They do not authorize conversions in this review. Use the reporting check in the calculator pane to validate the order of the supplied quartiles.
Patient-Controlled Analgesia (PCA) Liquid Volumetric Protocol
Several trials report PCA pump consumption as delivered solution volume (in mL) or number of bolus compressions rather than mass of drug. In accordance with ASA Acute Pain Guidelines (2012), delivered doses are derived using the verified reservoir concentration:
$\text{Total Opioid Mass} = V_{\text{total}} \times C_{\text{solution}}$
Example: $45.7\text{ mL}$ PCIA solution with $1\,\mu\text{g/mL}$ sufentanil
$= 45.7\,\mu\text{g sufentanil} \times 1.0\text{ (IV MME factor)} = \mathbf{45.7\text{ mg IV MME}}$.
Demand Bolus & Lockout Verification
When compressions are reported without cumulative volume, total delivered dose accounts for successful boluses plus basal background rate:
$\text{Demand Mass} = N_{\text{delivered}} \times V_{\text{bolus}} \times C_{\text{solution}}$
Total 24-h Consumption:
$\text{Total} = \text{Demand Mass} + (24\text{ hours} \times \text{Basal Rate} \times C_{\text{solution}})$.
Select drug and enter 24h consumption to inspect the review conversion convention. Only four of these factors are applied to trial data; the rest are reference-only. See the result note.
Check the reported median and quartile order without estimating mean or SD.
Wan X, Wang W, Liu J, Tong T. (2014)
Estimating the sample mean and standard deviation from the sample size, median, range and/or interquartile range.
DOI: 10.1186/1471-2288-14-135 ↗
Luo D, Wan X, Liu J, Tong T. (2018)
Optimally estimating the sample mean from the sample size, median, mid-range, and/or mid-quartile range.
DOI: 10.1177/0962280216669183 ↗
Shi J, Luo D, Weng H, et al. (2020)
Optimally estimating the sample standard deviation from the five-number summary.
DOI: 10.1002/jrsm.1429 ↗
Higgins JPT, Thomas J, et al. (eds) (2023)
Cochrane Handbook for Systematic Reviews of Interventions, Version 6.4. Chapter 6: Choosing effect measures.
training.cochrane.org/handbook ↗
Dowell D, Ragan KR, Jones CM, et al. (2022)
CDC Clinical Practice Guideline for Prescribing Opioids for Pain — United States, 2022.
opioid_conversion_audit.csv).
DOI: 10.15585/mmwr.rr7103a1 ↗
Macintyre PE, Schug SA, Scott DA, et al. (2020)
Acute Pain Management: Scientific Evidence (5th edition). Australian and New Zealand College of Anaesthetists.
anzca.edu.au ↗
Treillet E, Liborio-Amancio L, et al. (2018)
Practical issues in calculating equianalgesic doses for opioids: a systematic review and clinical consensus.
DOI: 10.1007/s00520-017-3850-9 ↗
ASA Task Force on Acute Pain (2012)
Practice guidelines for acute pain management in the perioperative setting: an updated report.
DOI: 10.1097/ALN.0b013e31823c1030 ↗
GRADE Summary of Findings (SoF) Table (Objective 7)
Saved GRADE assessments for the established target analyses. The additional v33 secondary analysis sets shown on the Secondary tab await result-specific RoB 2 adjudication and have no GRADE rating; these earlier ratings do not transfer to them.
| Outcome Endpoint | Anticipated Absolute Effect | Pooled Effect (95% CI) | Participants (Studies) | Certainty (GRADE) | Downgrade Assessment & Footnotes |
|---|
- TEAS vs Sham (0–24 h Opioid Sparing, k=4, N=337): Low certainty evidence (downgraded for inconsistency and imprecision). The pooled estimate was MD −14.00 mg IV MME [95% KH CI: −34.18, +6.19], p = 0.1145; 95% confidence interval crosses zero with substantial between-trial heterogeneity (I² = 98.6%).
- EA vs Usual Care (0–24 h Opioid Sparing, k=3, N=339): Very low certainty evidence (downgraded for inconsistency and very serious imprecision). The pooled point estimate was MD −3.94 mg IV MME [95% KH CI: −19.77, +11.90], p = 0.3969; 95% confidence interval crosses zero and is imprecise.
- Supporting Combined Strict-Evidence Synthesis (0–24 h, k=7, N=676): Low certainty evidence (MD −9.91 mg IV MME [95% KH CI: −20.08, +0.27], p = 0.0545, 95% PI [−39.35, +19.54]). Modality-specific estimates remain the primary inferential analyses.
- Note on RoB 2 Domain Status: Outcome ratings incorporate locked result-specific RoB 2 assessments across primary and key secondary endpoints.
Analyses computed but not reported as findings — and why
Data Export & Statistical Pipeline Downloads
Export the active filtered dataset containing study-level effect sizes, sample sizes, and RoB 2 classifications for independent statistical auditing, or download the master Stata 19.5 BE replication suite.